77-727 Online Exam

Excel 2016 Core Data Analysis, Manipulation, and Presentation

35 questions available ยท Page 1 of 4

View study plans
Question 1 Lab simulation

Simulation

Project 7 of 7: Farmers Market

Overview

You are the Director of a local farmers' market. You are creating and modifying charts for a report which shows the amounts and variety of products sold during the season.
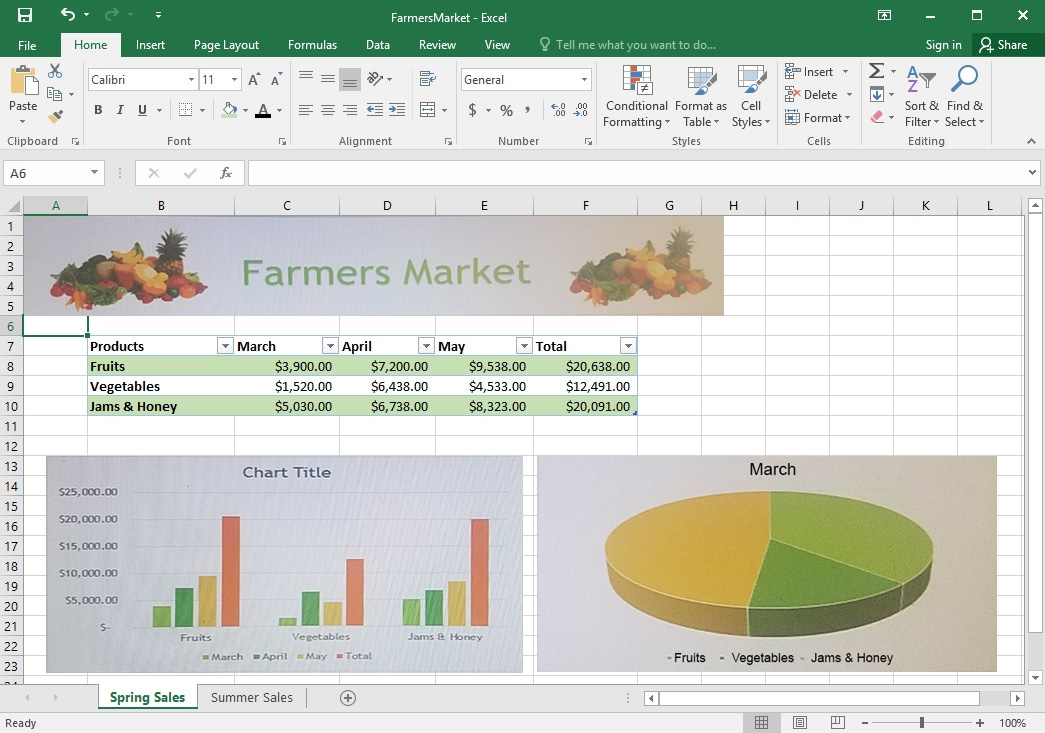
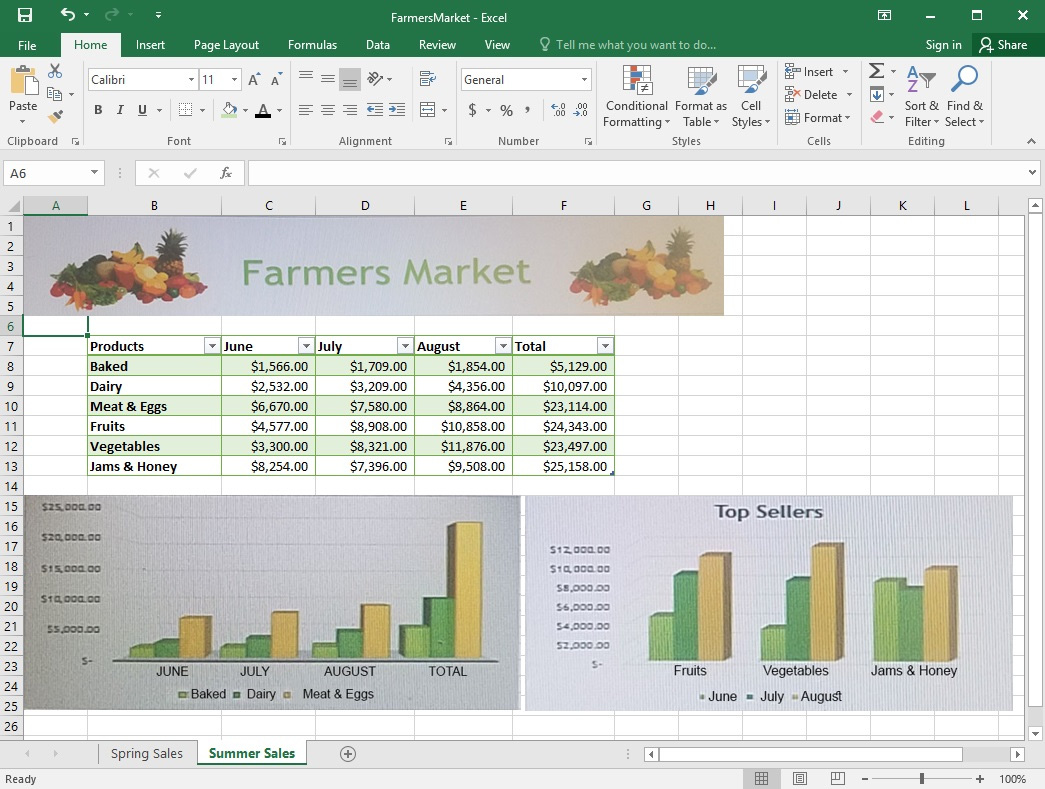
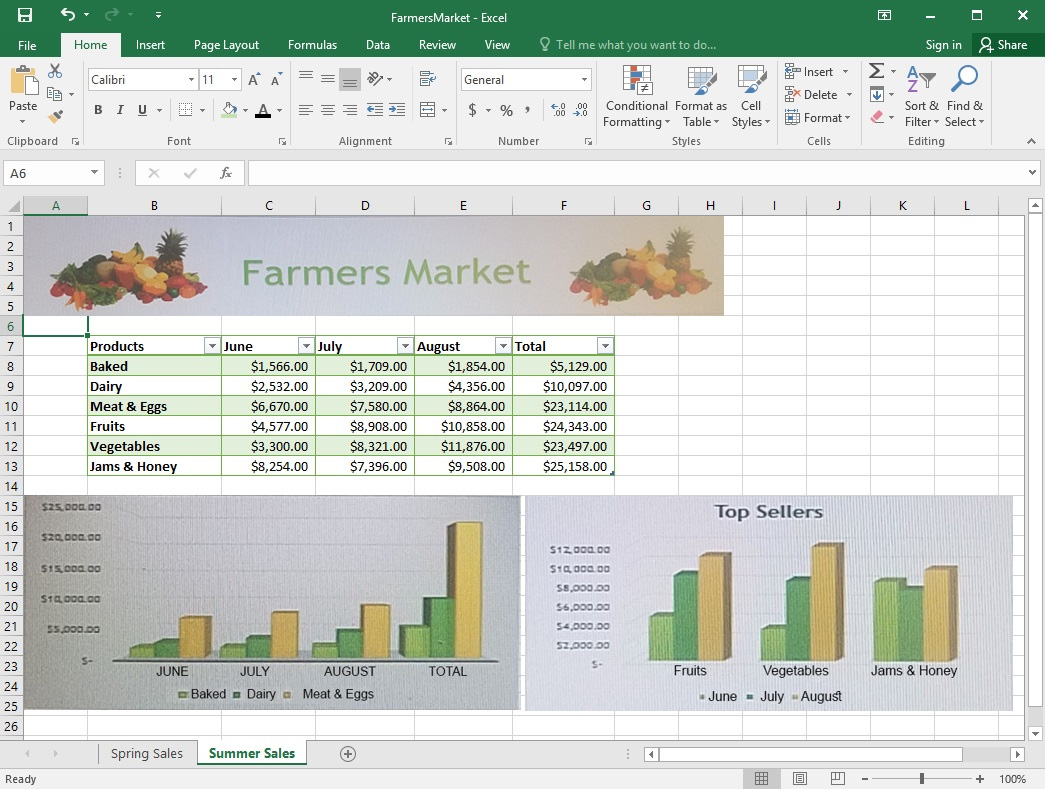
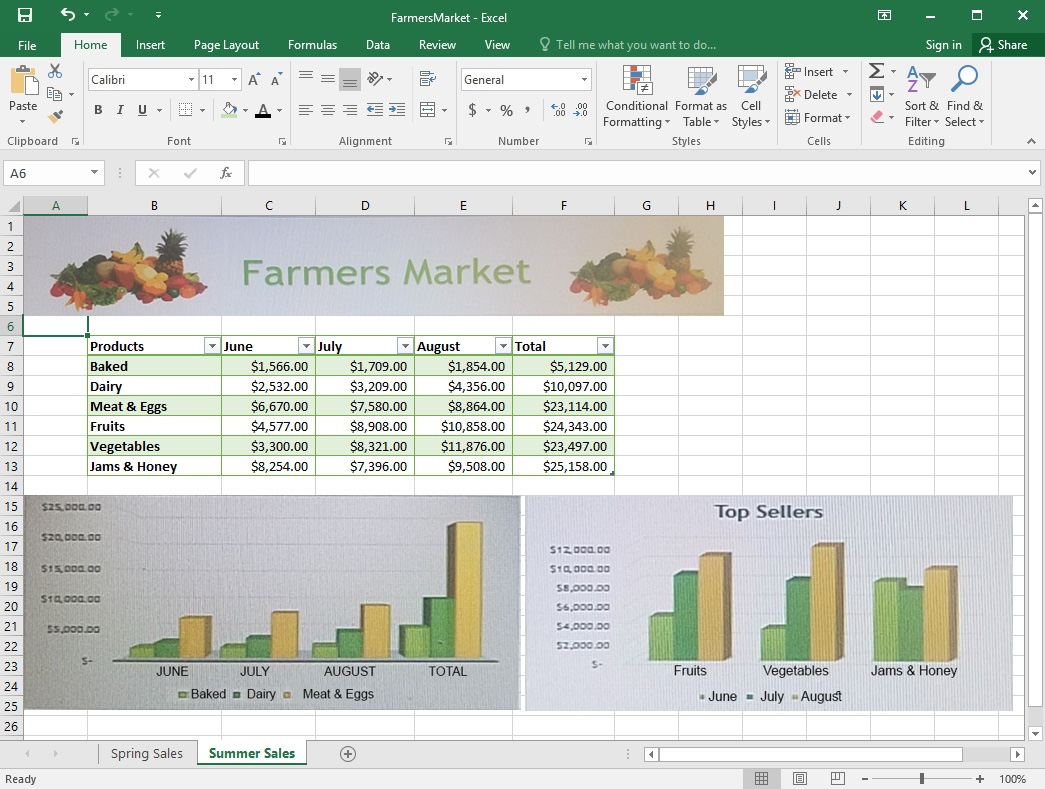
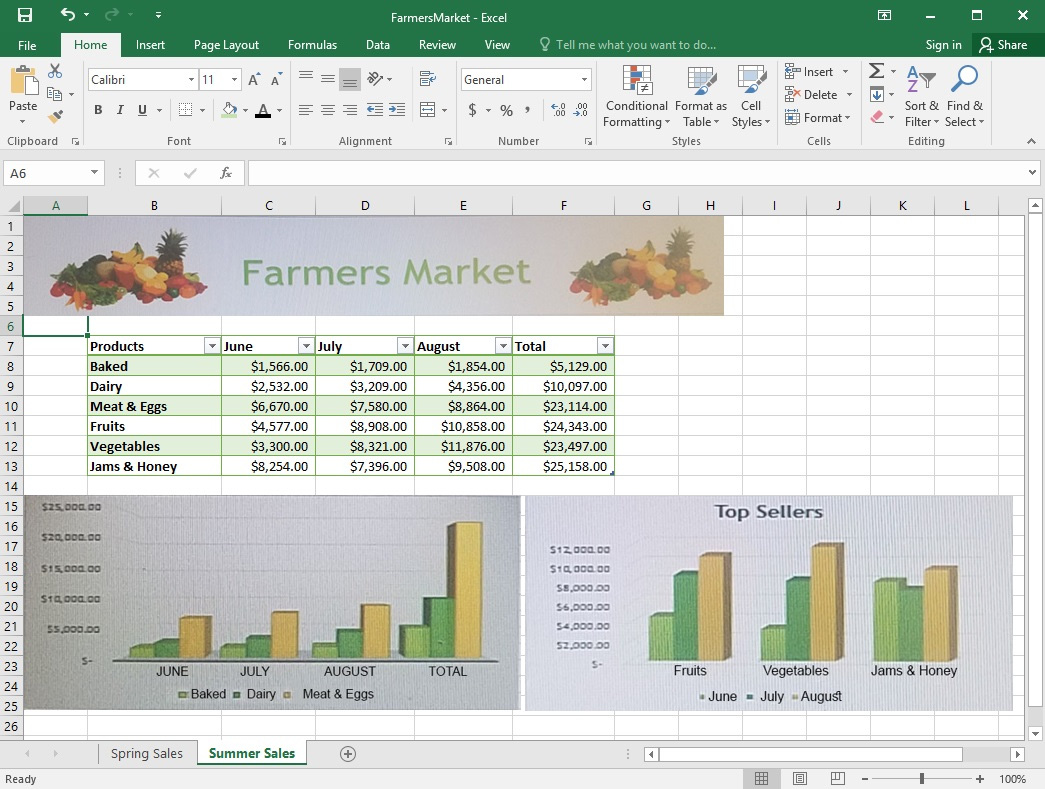
On the "Summer Sales" worksheet, switch the rows with the columns on the first column chart.

Show answer and explanation

Explanation:
1. Select the first row OR column on the "Summer Sales" worksheet and Copy either from the Home tab OR by pressing Ctrl+C on the keyboard.
2. Select the first cell where you want to paste the data, then click on the arrow next to Paste situated on the Home tab, then select Transpose.
3. Pick a spot with enough space to paste your data, the copied data will overwrite the already existing data that is already there.
4. Once completed, you can delete the original data if desired.

References:
https://support.office.com/en-us/article/Transpose-data-from-rows-to-columns-or-vice-versa-in-Excel-for-Mac-9c16dd55-ed1a-4aa2-8b74-b1b9211e2ede
Question 2 Lab simulation

Simulation

Project 7 of 7: Farmers Market

Overview

You are the Director of a local farmers' market. You are creating and modifying charts for a report which shows the amounts and variety of products sold during the season.

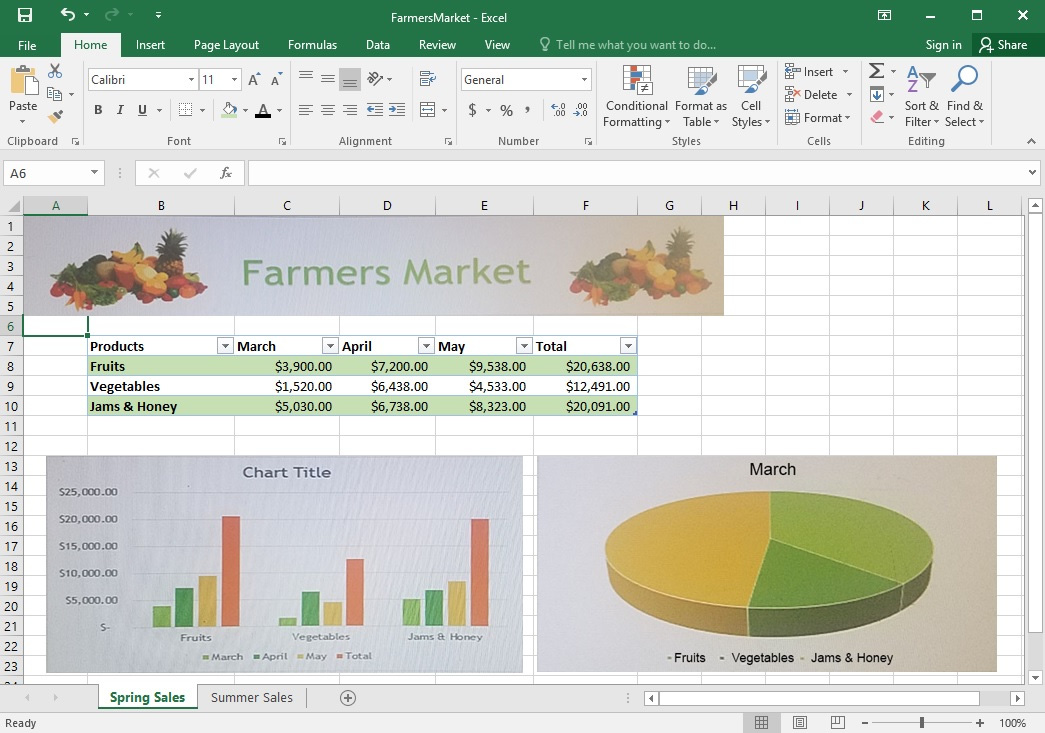
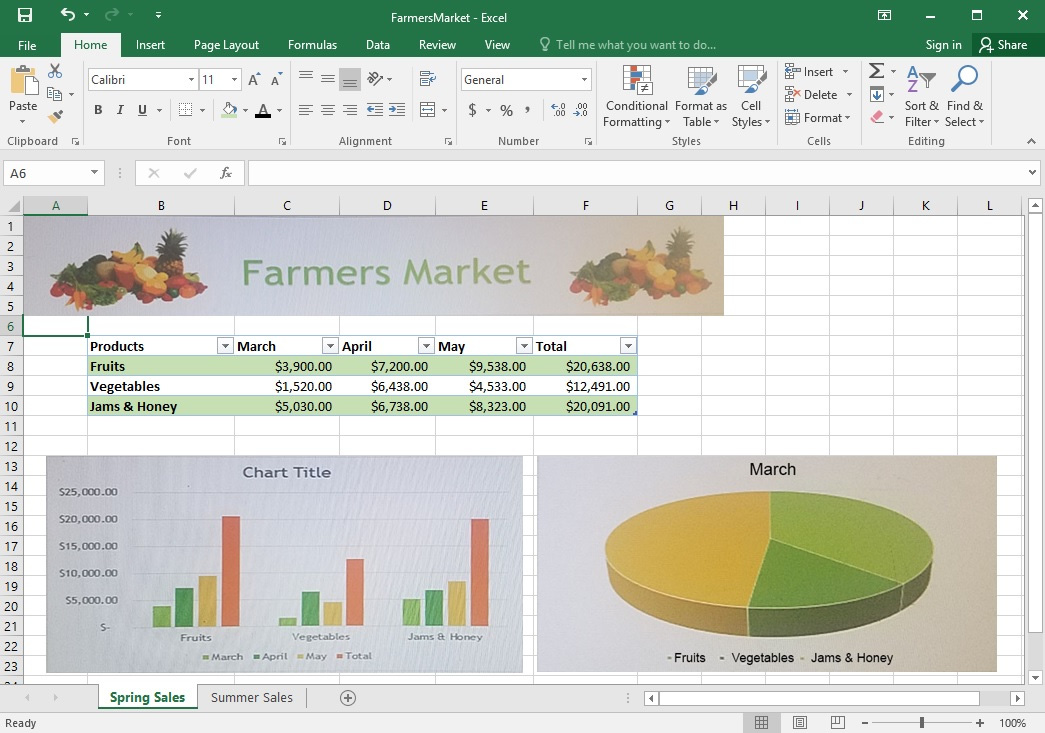
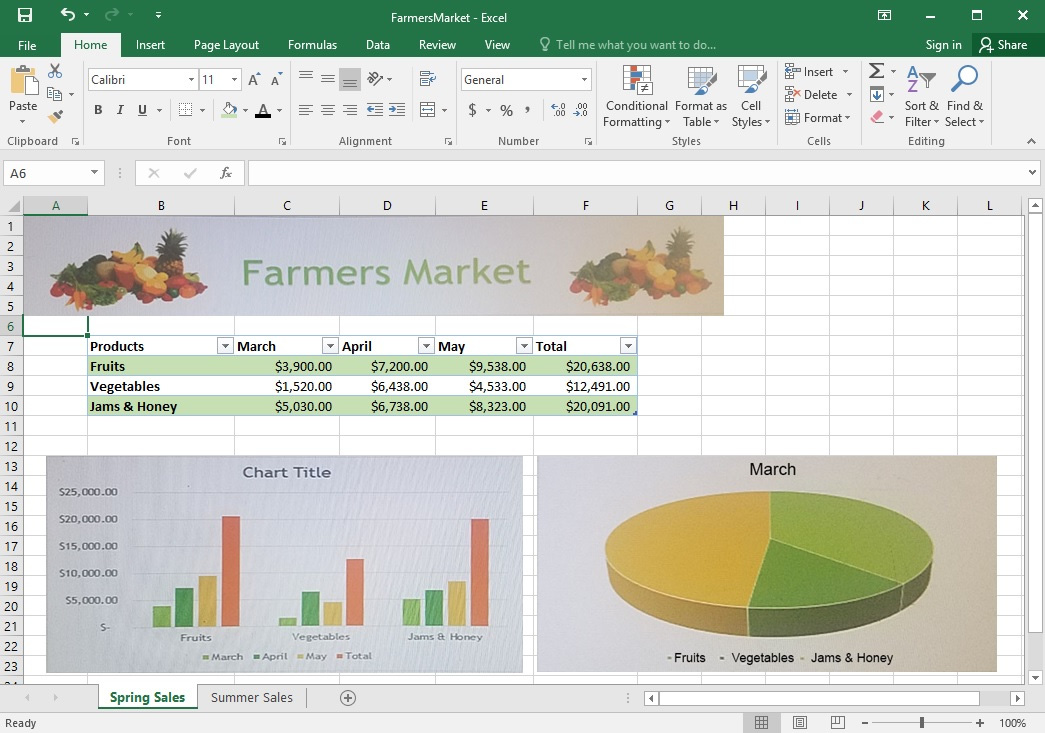
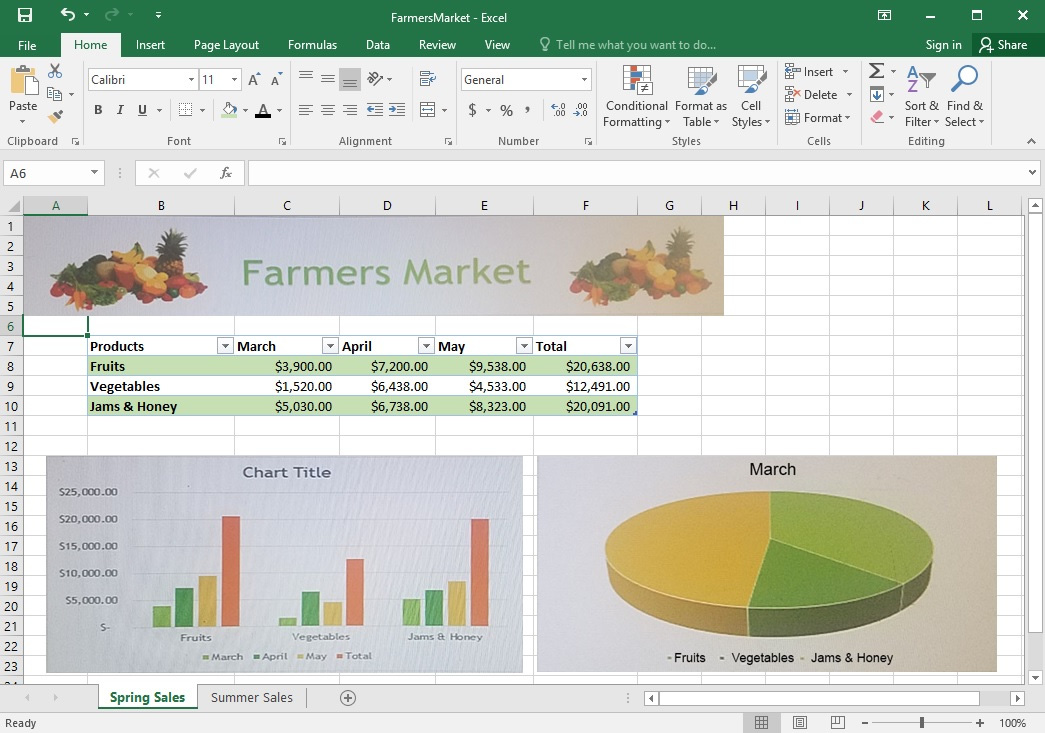
On the "Spring Sales" worksheet, apply Style 3 and Monochromatic Color 2 (Monochromatic Palette 2) to the 3-D Pie chart.

Show answer and explanation

Explanation:
1. Click on the 3-D Pie Chart on the "Spring Sales" worksheet.
2. This would display the Chart Tools, click on the desired style which is Style 3 Monochromatic Color 2 from the Chart Styles group situated on the Design tab.

References:
https://support.office.com/en-us/article/Change-the-layout-or-style-of-a-chart-A346E438-D22A-4540-AA87-BCE9FEB719CF

Question 3 Lab simulation

Simulation

Project 7 of 7: Farmers Market

Overview

You are the Director of a local farmers' market. You are creating and modifying charts for a report which shows the amounts and variety of products sold during the season.

On the "Spring Sales" worksheet, add the title "New Products" to the column chart. Label the vertical axis
"Gross Sales" and the horizontal axis "Months".

Show answer and explanation

Explanation:
1. Click on the title on the "Spring Sales" worksheet, then type "New Products".
2. You can edit the Font of the title from the mini-toolbar that appears OR from the Home tab.
3. Click directly on either the x-axis or y-axis in the chart OR click the Chart Elements button.
4. For editing the x-axis which is the horizontal category then type "Months".
5. Do the same to edit the y-axis which is the vertical category and type "Gross Sales".
6. You can further edit the text of the data in either of the axis as desired.

References:
https://www.dummies.com/software/microsoft-office/excel/how-to-edit-chart-titles-in-excel-2016/

Question 4 Lab simulation

Simulation

Project 7 of 7: Farmers Market

Overview

You are the Director of a local farmers' market. You are creating and modifying charts for a report which shows the amounts and variety of products sold during the season.

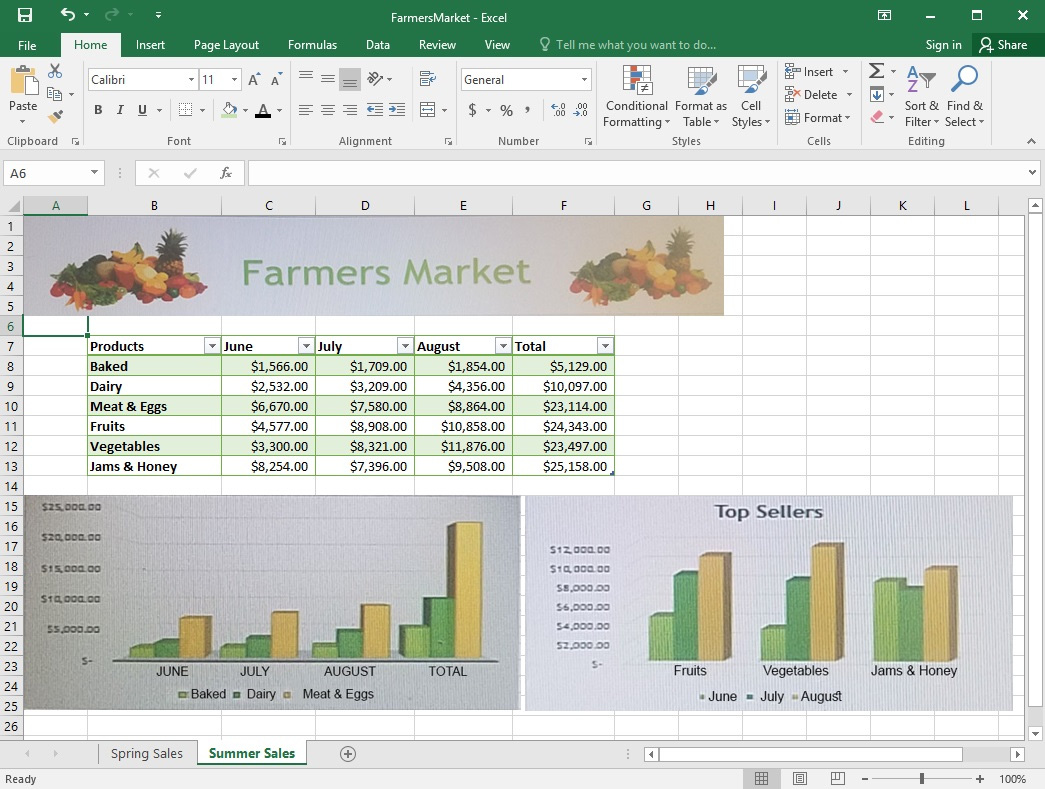
On the "Summer Sales" worksheet, add the "Total" data series to the "Top Sellers" column chart. Include the total only for "Fruits", "Vegetables", and "Jams & Honey".

Show answer and explanation

Explanation:
1. Select the "Top Sellers" column chart.
2. Click on the particular data point you want to label, click Add Chart Element +, from the upper right corner next to the chart, then select Data Labels.
3. Then click Format Data Labels.
4. The Data Label Range dialog box would appear, select the data range which are the cell values you want to appear in the labels, in this case it would be the "Total" colunn for "Fruits", "Vegetables", and "Jams
& Honey", then click OK.

References:
https://support.office.com/en-us/article/add-or-remove-data-labels-in-a-chart-884bf2f1-2e29-454e-8b42-f467c9f4eb2d

Question 5 Lab simulation

Simulation

Project 7 of 7: Farmers Market

Overview

You are the Director of a local farmers' market. You are creating and modifying charts for a report which shows the amounts and variety of products sold during the season.

On the "Summer Sales" worksheet, use the data in the "Products" and "Total" columns only to create a 3-D
Pie chart. Position the new chart to the right of the column charts.

Show answer and explanation

Explanation:
1. Select the data you would like to use, in this case it would be the data in the "Products" and "Total" columns from the "Summer Sales" worksheet.
2. Click on Insert Pie Chart situation on the Insert tab then pick the 3-D Pie chart as desired.
3. Format the chart as desired by using Chart Elements, the Chart Styles, or the Chart Filters.
4. Drag the Pie Chart to the desired location which is to the right of the column charts.

References:
https://support.office.com/en-us/article/Add-a-pie-chart-1A5F08AE-BA40-46F2-9ED0-FF84873B7863

Question 6 Lab simulation

Simulation

Project 6 of 7: Bike Tours

Overview

You are the owner of a small bicycle tour company summarizing trail rides that have been booked for the next six months.

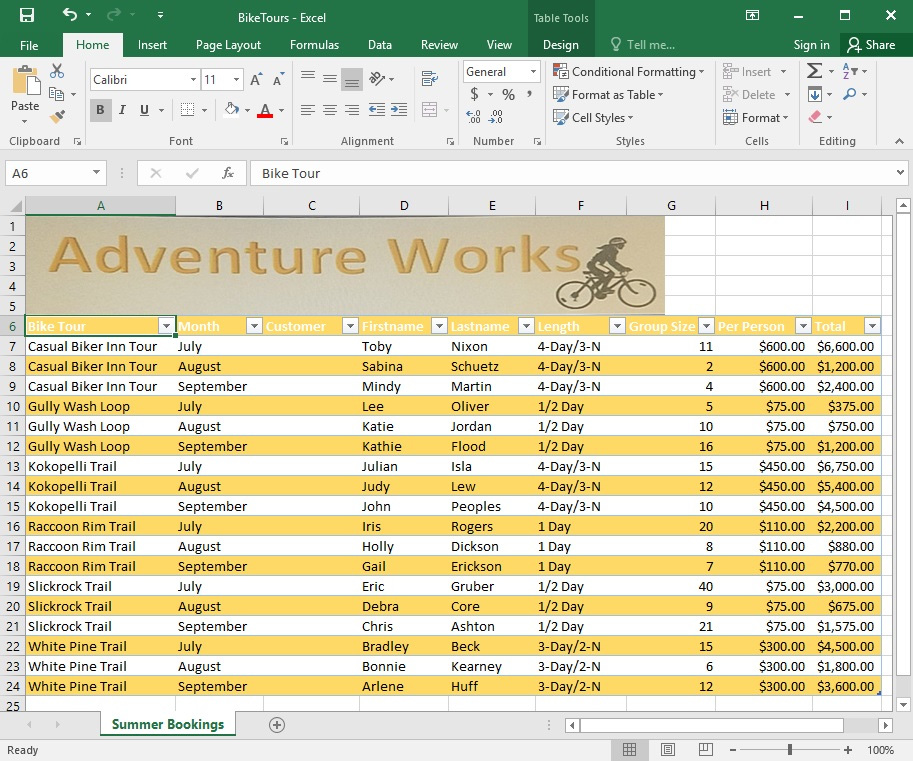
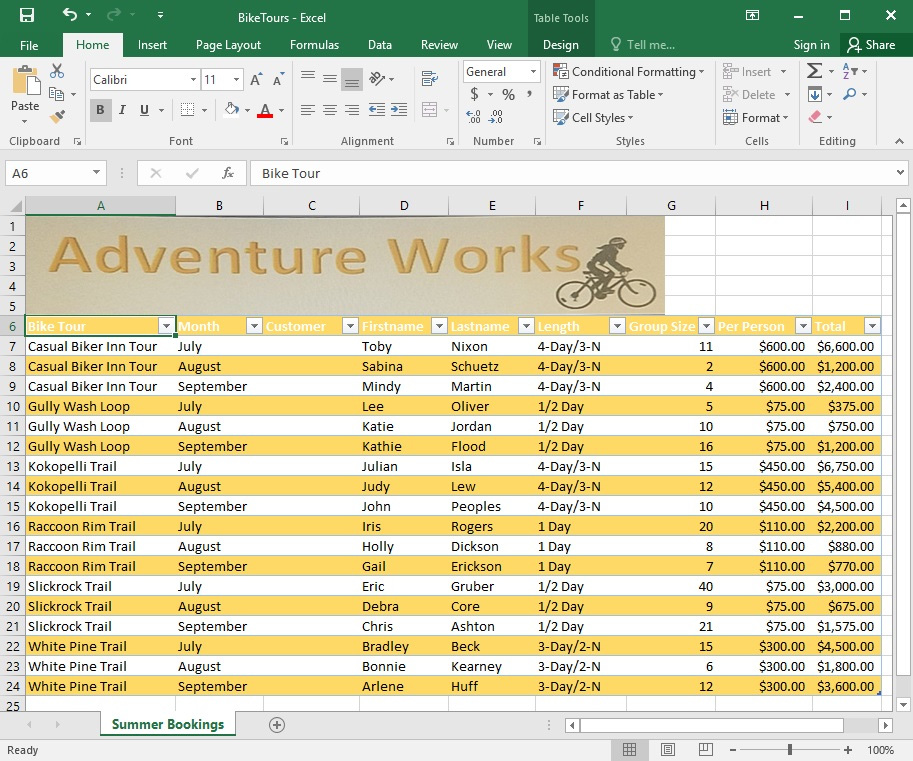
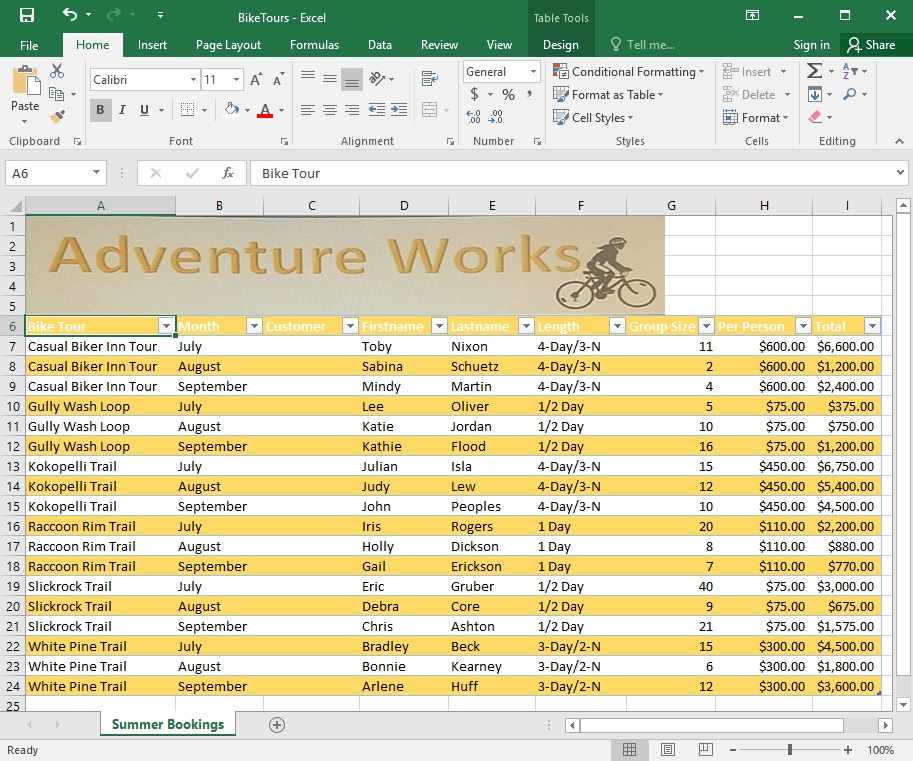
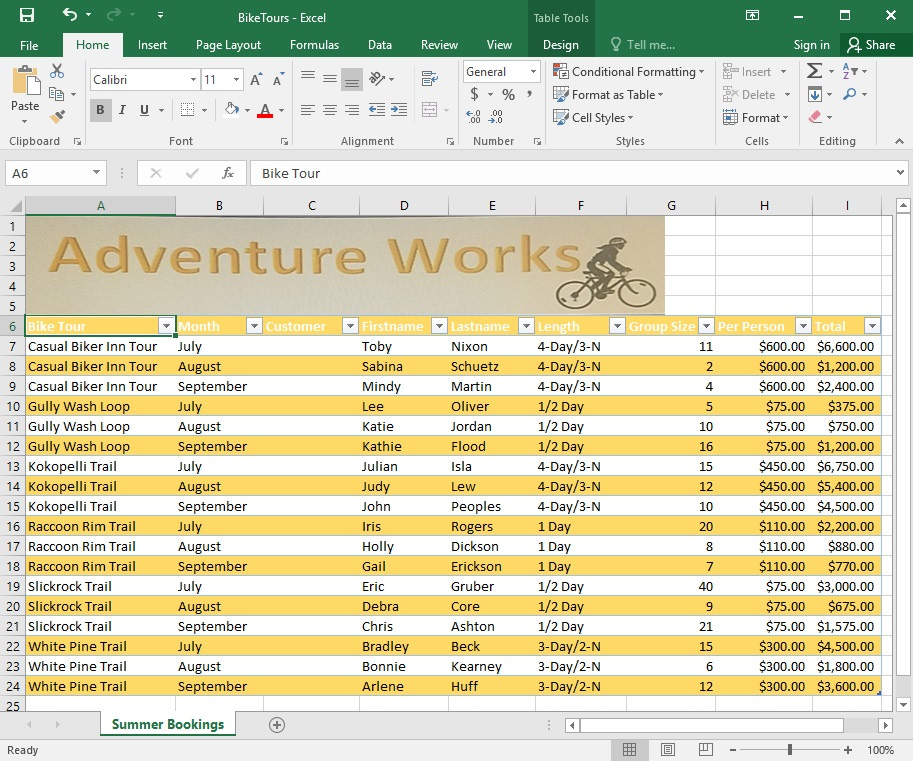
Insert page numbering in the center of the footer on the "Summer Bookings" worksheet using the format Page 1 of ?.

Show answer and explanation

Explanation:
1. On the "Summer Bookings" worksheet, click Header & Footer from the Text group situation on the Insert tab.
2. Click Click to add footer which would display the Header & Footer tools which gets added to the
Design tab.
3. Specify where the page number should be by selecting the Center section box.
4. On the Design tab in the Header & Footer Elements group, click Page Number.
5. The placeholder &[Page] will appear in the selected section, to add the total number of pages type the word of followed by the space in the Header & Footer Elements group after clicking Number of Pages, then the placeholder &[Page] of &[Pages] appear.
6. Click anywhere outside the header or footer area to display the page numbers in Page Layout View.
7. Once you are done working in the Page Layout View, click Normal in the Workbook Views group situated on the View tab. OR You can also click Normal on the status bar.

References:
https://support.office.com/en-us/article/Insert-page-numbers-on-worksheets-27A88FB9-F54E-4AC4-84D7-BF957C6CE29C

Question 7 Lab simulation

Simulation

Project 6 of 7: Bike Tours

Overview

You are the owner of a small bicycle tour company summarizing trail rides that have been booked for the next six months.

On the "Summer Bookings" worksheet, remove the table functionality from the table. Retain the cell formatting and location of the data.

Show answer and explanation

Explanation:
1. Click Design from the Ribbon on Table Tools.
2. In the Tools group, click on Convert to Range.

OR

1. Right-click the table then click on Table then press Convert to Range.

References:
https://support.office.com/en-us/article/convert-an-excel-table-to-a-range-of-data-0b326ff1-1764-4ebe-84ea-786265d41c77?redirectSourcePath=%252fen-us%252farticle%252fRemove-a-table-without-losing-the-data-or-table-format-ADF88635-90F5-4FAA-9417-19862F38CCE8&ui=en-US&rs=en-US&ad=US

Question 8 Lab simulation

Simulation

Project 6 of 7: Bike Tours

Overview

You are the owner of a small bicycle tour company summarizing trail rides that have been booked for the next six months.

In cell C8 on the "Summer Bookings" worksheet, insert a function that joins the customer "Lastname" to the customer "Firstname" separated by a comma and space. (Example: Campbell, David).

Show answer and explanation

Explanation:

1. In cell C8 on the "Summer Bookings" worksheet, insert the following CONCAT function: "=CONCAT(E6 ", "D6)" OR "=E6& ", ", D6".

References:
https://support.office.com/en-us/article/Combine-text-from-two-or-more-cells-into-one-cell-81ba0946-ce78-42ed-b3c3-21340eb164a6

Question 9 Lab simulation

Simulation

Project 6 of 7: Bike Tours

Overview

You are the owner of a small bicycle tour company summarizing trail rides that have been booked for the next six months.

In cell M10 on the "Summer Bookings" worksheet, insert a function that calculates the total amount of sales from the "Total" column for groups containing 12 or more people even if the order of the rows is changed.

Show answer and explanation

Explanation:
1. In cell M10 on the "Summer Bookings", insert the following SUMIF formula: "=SUMIF(G6:G24, ">= 12",
I6:I24)."'

References:
https://support.office.com/en-us/article/SUMIF-function-169B8C99-C05C-4483-A712-1697A653039B

Question 10 Lab simulation

Simulation

Project 6 of 7: Bike Tours

Overview

You are the owner of a small bicycle tour company summarizing trail rides that have been booked for the next six months.

In cell M9 on the "Summer Bookings" worksheet, insert a function that calculates the number of groups

containing 12 or more people even if the order of the rows is changed.

Show answer and explanation

Explanation:
1. In cell M9, on the "Summer Bookings" worksheet, insert the following COUNTIF formula: "=COUNTIF (G6:G24, >= 12")"

References:
https://support.office.com/en-us/article/count-numbers-greater-than-or-less-than-a-number-453b0ccc-cfaa-4332-ad02-6e148e01aa0a