Exam Details
Exam Code
:CLSSYBExam Name
:Certified Lean Six Sigma Yellow Belt (LSSYB)Certification
:Six Sigma CertificationsVendor
:Six SigmaTotal Questions
:340 Q&AsLast Updated
:Apr 10, 2025
Six Sigma Six Sigma Certifications CLSSYB Questions & Answers
-
Question 271:
Which statement(s) are true about the Fitted Line Plot shown here?
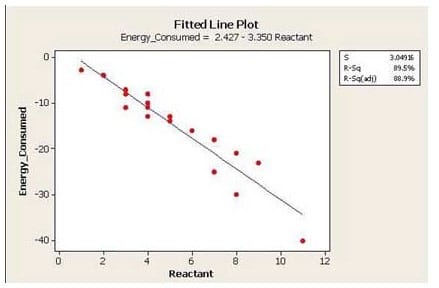
A. When Reactant increases, the Energy Consumed increases.
B. The predicted output Y is close to -18 when the Reactant level is set to 6.
C. Over 85 % of the variation of the Energy Consumed is explained by the Reactant via this Linear Regression.
D. Both b and c
-
Question 272:
A 1-Sample t-test is used to compare an expected population Mean to a target.
A. True
B. False
-
Question 273:
Multiple Linear Regressions (MLR) is best used when which of these are applicable?
A. We assume that the X's are independent of each other
B. Preventing the use of a Designed Experiment if unnecessary
C. Relationships between Y (output) and more than one X (Input)
D. All of the above
-
Question 274:
The generation of a Regression Equation is justified when we _____.
A. Expect the relationship to be Linear between the output and inputs
B. Experience several process defects and have no other way to fix hem
C. Need to understand how to control a process output by controlling the input(s)
D. All of the above
-
Question 275:
The actual experimental response data varied somewhat from what a Belt had predicted them to be. This is the result of which of these?
A. Inefficiency of estimates
B. Residuals
C. Confounded data
D. Gap Analysis
-
Question 276:
Unequal Variances can be the result of differing types of distributions.
A. True
B. False
-
Question 277:
After reviewing the Capability Analysis shown here select the statement that is untrue.
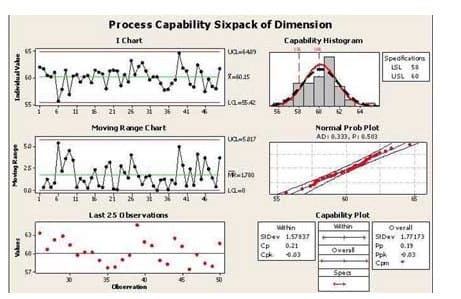
A. The process is properly assumed to be a Normal process
B. The Mean of the process moving range is 1.78
C. The process is out of Control
D. This Capability Analysis used subgroups
-
Question 278:
The Regression Model for an observed value of Y contains the term to which represents the Y axis intercept when X = 0.
A. True
B. False
-
Question 279:
A Belt will occasionally do a quick experiment referred to as an OFAT which stands for _____.
A. Only a Few Are Tested
B. Opposite Factors Affect Technique
C. One Factor At a Time
D. Ordinary Fractional Approach Technique
-
Question 280:
Which statement(s) are correct for the Regression Analysis shown here?
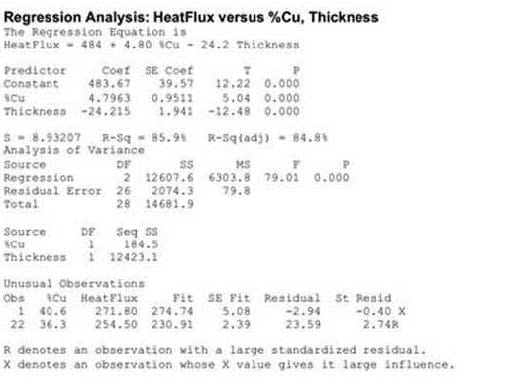
A. This Regression is an example of a Multiple Linear Regression.
B. This Regression is an example of Cubic Regression.
C. Thickness explains over 80% of the process variance in heat flux.
D. Both a and c
Related Exams:
Tips on How to Prepare for the Exams
Nowadays, the certification exams become more and more important and required by more and more enterprises when applying for a job. But how to prepare for the exam effectively? How to prepare for the exam in a short time with less efforts? How to get a ideal result and how to find the most reliable resources? Here on Vcedump.com, you will find all the answers. Vcedump.com provide not only Six Sigma exam questions, answers and explanations but also complete assistance on your exam preparation and certification application. If you are confused on your CLSSYB exam preparations and Six Sigma certification application, do not hesitate to visit our Vcedump.com to find your solutions here.