Exam Details
Exam Code
:E20-007Exam Name
:Data Science and Big Data AnalyticsCertification
:EMC CertificationsVendor
:EMCTotal Questions
:198 Q&AsLast Updated
:
EMC EMC Certifications E20-007 Questions & Answers
-
Question 91:
You have been assigned to perform a study of the daily revenue effect of a pricing model of online transactions. All data currently available to you has been loaded into your analytics database. This includes revenue data, pricing data, and online transaction data.
You discover that all data comes in different levels of granularity. The transaction data has timestamps consisting of day, hour, minutes, and seconds. Pricing is stored at the daily level and revenue data is only reported monthly.
What is the next step?
A. Report back to the business owner that the current data model does not support the business question.
B. Interpolate a daily model for revenue from the monthly revenue data.
C. Aggregate all data to the monthly level in order to create a monthly revenue model.
D. Disregard revenue as the key reason in the pricing model and create a daily model based on pricing and transactions only.
-
Question 92:
Refer to the exhibit.
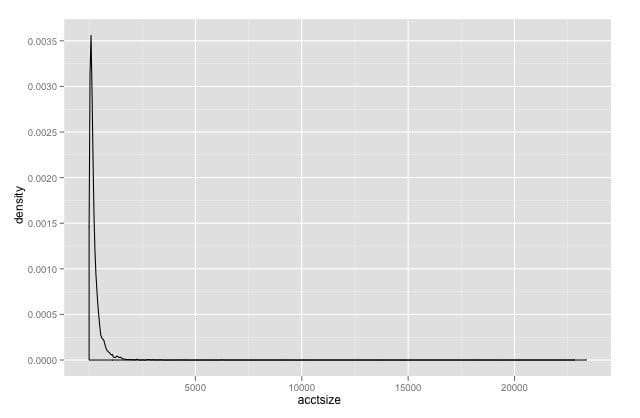
You have plotted the distribution of savings account sizes for your bank. How would you proceed, based on this distribution?
A. The data is extremely skewed. Replot the data on a logarithmic scale to get a better sense of it.
B. The data is extremely skewed, but looks bimodal; replot the data in the range 2, 500-10, 000 to be sure.
C. The accounts of size greater than 2500 are rare, and probably outliers. Eliminate them from your future analysis.
D. The data is extremely skewed. Split your analysis into two cohorts: accounts less than 2500, and accounts greater than 2500
-
Question 93:
What are the characteristics of Big Data?
A. Data volume, processing complexity, and data structure variety.
B. Data volume, business importance, and data structure variety.
C. Data type, processing complexity, and data structure variety.
D. Data volume, processing complexity, and business importance.
-
Question 94:
You have plotted the distribution of savings account sizes for a bank.
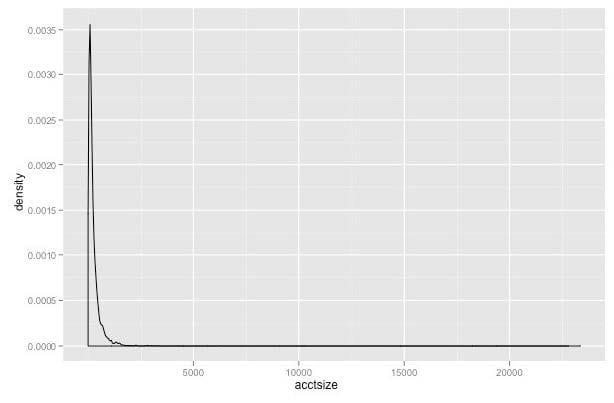
Based on the distribution shown in the exhibit, how would you proceed?
A. Data is extremely skewed. Replot the data on a logarithmic scale to get a better understanding of it.
B. Data is extremely skewed but looks bimodal. Replot the data in the range 2,500 - 10,000 to be certain.
C. Accounts of sizes greater than 2,500 are rare and are most likely outliers. Eliminate them from future analysis.
D. Data is extremely skewed. Split the analysis into two cohorts; accounts less than 2,500 and accounts greater than 2,500.
-
Question 95:
What is the primary bottleneck in text classification?
A. The availablilty of tagged training data.
B. The ability to parse unstructured text data.
C. The high dimensionality of text data.
D. The fact that text corpora are dynamic.
-
Question 96:
In addition to less data movement and the ability to use larger datasets in calculations, what is a benefit of analytical calculations in a database?
A. quicker time to insight
B. more efficient handling of categorical values
C. improved connections between disparate data sources
D. full use of data aggregation functionality
-
Question 97:
On analyzing your time series data you suspect that the data represented as y1, y2, y3, ... , yn-1, yn may have a trend component that is quadratic in nature. Which pattern of data will indicate that the trend in
the time series data is quadratic in nature?
A. (y3-y2) ?(y2-y1) = .........= (yn-yn-1)-(yn-1-yn-2)
B. (y2-y1) = (y3-y2) = ....... = (yn-yn-1)
C. ((y2-y1) /y1 ) * 100% = .......((yn-yn-1)/yn-1) * 100%
D. (y4-y2) ?(y3-y1) = .........= (yn-yn-2)-(yn-1-yn-3)
-
Question 98:
Refer to the exhibit Consider the training data set shown in the exhibit. What are the classification (Y = 0 or 1) and the probability of the classification for the tupleX(0, 0, 1) using Naive Bayesian classifier?
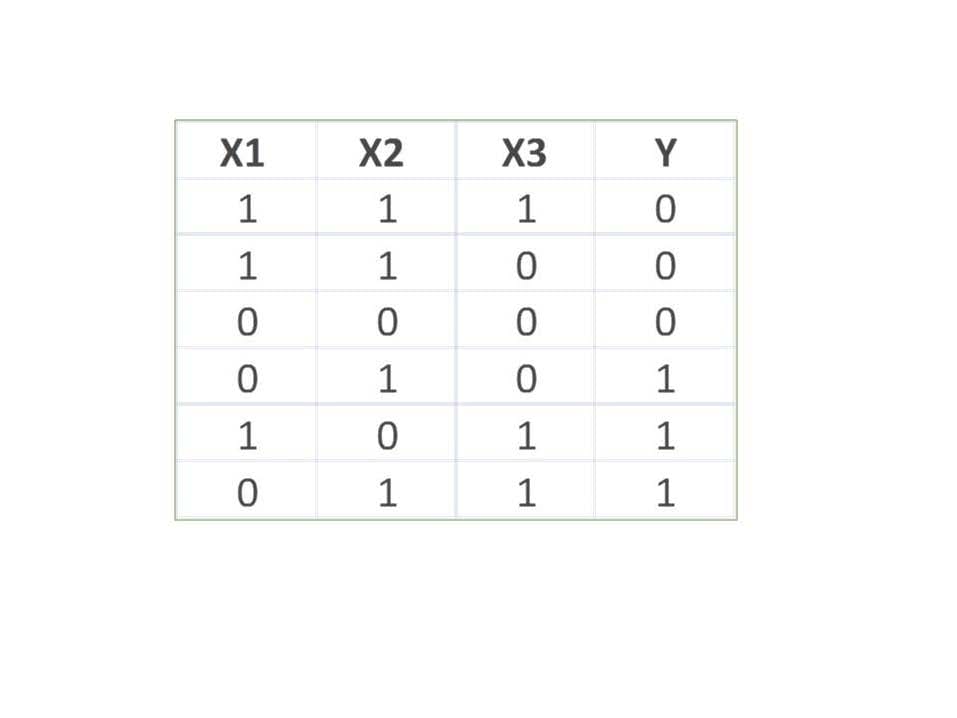
A. Classification Y = 1, Probability = 4/54
B. Classification Y = 0, Probability = 1/54
C. Classification Y = 1, Probability = 1/54
D. Classification Y = 0, Probability = 4/54
-
Question 99:
Trend, seasonal, and cyclical are components of a time series. What is another component?
A. Irregular
B. Linear
C. Quadratic
D. Exponential
-
Question 100:
Refer to the Exhibit.
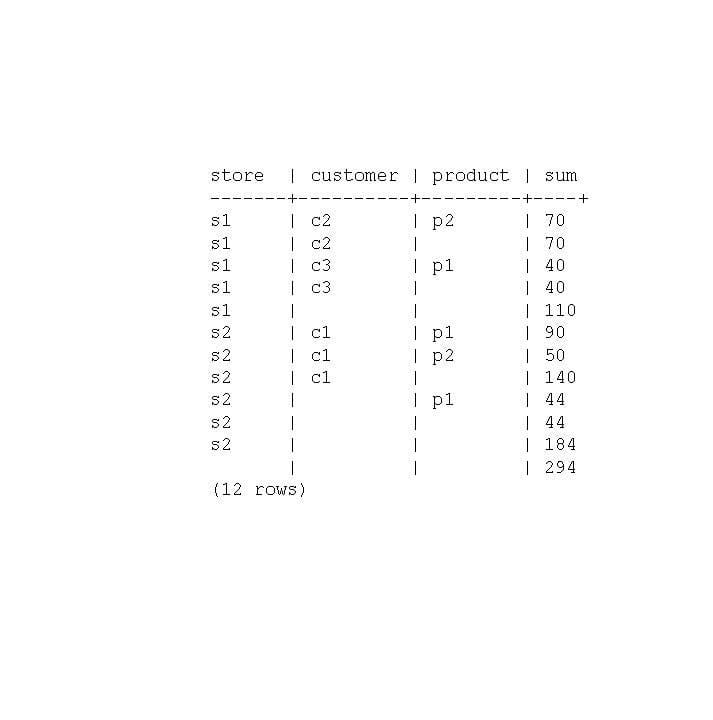
You are working on creating an OLAP query that outputs several rows of with summary rows of subtotals and grand totals in addition to regular rows that may contain NULL as shown in the exhibit. Which function can you use in your query to distinguish the row from a regular row to a subtotal row?
A. GROUPING
B. RANK
C. GROUP_ID
D. ROLLUP
Related Exams:
D-GAI-F-01
Dell GenAI Foundations AchievementD-MSS-DS-23
Dell Midrange Storage Solutions Design 2023D-OME-OE-A-24
Dell OpenManage Operate AchievementD-PDD-DY-23
Dell PowerProtect DD Deploy 2023D-PE-OE-23
Dell PowerEdge Operate 2023D-PEXE-IN-A-00
Dell PowerEdge XE9680 and XE8640 InstallD-PSC-MN-01
Dell GenAI Foundations AchievementD-PST-MN-A-24
Dell PowerStore Maintenance AchievementD-PWF-DS-23
Dell PowerFlex Design 2023D-RP-DY-A-24
Dell RecoverPoint Deploy Achievement
Tips on How to Prepare for the Exams
Nowadays, the certification exams become more and more important and required by more and more enterprises when applying for a job. But how to prepare for the exam effectively? How to prepare for the exam in a short time with less efforts? How to get a ideal result and how to find the most reliable resources? Here on Vcedump.com, you will find all the answers. Vcedump.com provide not only EMC exam questions, answers and explanations but also complete assistance on your exam preparation and certification application. If you are confused on your E20-007 exam preparations and EMC certification application, do not hesitate to visit our Vcedump.com to find your solutions here.