Which one of the following values will appear first if they are sorted in descending order?
A. Aaron.
B. Molly.
C. Xavier.
D. Adam.
Correct Answer: C
Explanation: The value that will appear first if they are sorted in descending order is Xavier. Descending order means arranging values from the largest to the smallest, or from the last to the first in alphabetical order. In this case, Xavier is the last name in alphabetical order, so it will appear first when sorted in descending order. The other names will appear in the following order: Molly, Adam, Aaron. Reference: Sorting Data - W3Schools
Question 172:
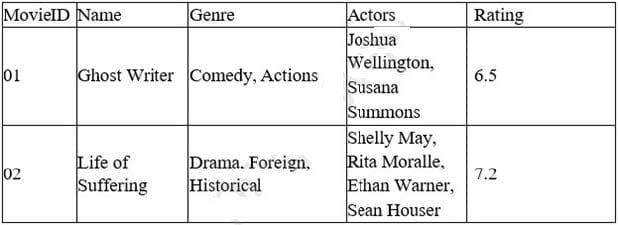
A data analyst for a media company needs to determine the most popular movie genre. Given the table below:
Which of the following must be done to the Genre column before this task can be completed?
A. Append
B. Merge
C. Concatenate
D. Delimit
Correct Answer: D
Explanation: The action that must be done to the Genre column before this task can be completed is delimit. Delimit is a process of separating or splitting a string of text into multiple parts based on a delimiter, which is a character or a sequence of characters that marks the boundary between the parts. For example, a comma (,) or a semicolon (;) can be used as a delimiter. In this case, the Genre column contains multiple genres for each movie, separated by commas. To determine the most popular movie genre, the data analyst needs to delimit the Genre column by commas, so that each genre can be counted and compared separately. The other options are not relevant for this task, as they are related to combining or joining strings or tables, not separating them. Append is a process of adding or attaching one string or table to the end of another string or table. Merge is a process of combining or joining two or more tables into one table based on a common column or key. Concatenate is a process of joining or linking two or more strings together into one string. Reference: [How to Split Text in Excel - Exceljet]
Question 173:
An analyst is working on a project for a director. During this process. the analyst pulled the data. created summarized tables and graphs with descriptions, created a report summary, and inserted all items into a report. After writing the report, which of the following would be the most appropriate next step?
A. Complete an audit on the data pulled for the report.
B. Complete a check for quality in the report.
C. Complete a review of the data and a check for consistency
D. Complete a trend analysis to be included in the report.
Correct Answer: B
After writing the report, the most appropriate next step for the analyst is to complete a check for quality in the report. This involves reviewing the report for accuracy, clarity, completeness, consistency, and relevance. The analyst should ensure that the report addresses the director's business questions and objectives, that the data and analysis are correct and reliable, that the tables and graphs are well-designed and easy to understand, that the descriptions and summary are concise and informative, and that there are no errors or inconsistencies in the report. A quality check will help the analyst to improve the presentation and communication of the report, as well as to avoid any misunderstandings or misinterpretations by the director1.
Question 174:
A data analyst needs to present the results of an online marketing campaign to the marketing manager. The manager wants to see the most important KPIs and measure the return on marketing investment. Which of the following should the data analyst use to BEST communicate this information to the manager?
A. A real-time monitor that allows the manager to view performance the day the campaign was launched
B. A sell-service dashboard that allows the manager to look at the company's annual budget performance
C. A spreadsheet of the raw data from all marketing campaigns and channels
D. A summary with statistics, conclusions, and recommendations from the data analyst
Correct Answer: D
Explanation: The option that the data analyst should use to best communicate the information to the manager is a summary with statistics, conclusions, and recommendations from the data analyst. A summary is a concise and clear way of presenting the main findings and insights from the data analysis report. A summary should include relevant statistics that support the conclusions and recommendations from the data analyst. A summary should also highlight the most important KPIs and measure the return on marketing investment in relation to the objectives of the online marketing campaign. The other options are not as effective as using a summary to communicate the information to the manager, as they either provide too much or too little information or do not address the manager's needs or expectations. A real-time monitor may provide too much information that can be overwhelming or distracting for the manager who wants to see only the most important KPIs and measure the return on marketing investment. A self-service dashboard may provide too little information that can be insufficient or unclear for the manager who wants to see some guidance and interpretation from the data analyst. A spreadsheet of raw data may provide irrelevant or inaccurate information that can be confusing or misleading for the manager who wants to see some analysis and insights from the data analyst. Reference: [How to Write an Executive Summary for Your Data Analysis Report - Towards Data Science]
Question 175:
Which of the following best describes the law of large numbers?
A. As a sample size decreases, its standard deviation gets closer to the average of the whole population.
B. As a sample size grows, its mean gets closer to the average of the whole population
C. As a sample size decreases, its mean gets closer to the average of the whole population.
D. When a sample size doubles. the sample is indicative of the whole population.
Correct Answer: B
The best answer is B. As a sample size grows, its mean gets closer to the average of the whole population. The law of large numbers, in probability and statistics, states that as a sample size grows, its mean gets closer to the average of the whole population. This is due to the sample being more representative of the population as it increases in size. The law of large numbers guarantees stable long-term results for the averages of some random events1 A. As a sample size decreases, its standard deviation gets closer to the average of the whole population is not correct, because it confuses the concepts of standard deviation and mean. Standard deviation is a measure of how much the values in a data set vary from the mean, not how close the mean is to the population average. Also, as a sample size decreases, its standard deviation tends to increase, not decrease, because the sample becomes less representative of the population.
C. As a sample size decreases, its mean gets closer to the average of the whole population is not correct, because it contradicts the law of large numbers. As a sample size decreases, its mean tends to deviate from the average of the whole population, because the sample becomes less representative of the population. D. When a sample size doubles, the sample is indicative of the whole population is not correct, because it does not specify how close the sample mean is to the population average. Doubling the sample size does not necessarily make the sample indicative of the whole population, unless the sample size is large enough to begin with. The law of large numbers does not state a specific number or proportion of samples that are indicative of the whole population, but rather describes how the sample mean approaches the population average as the sample size increases indefinitely.
Question 176:
A table in a hospital database has a column for patient height in inches and a column for patient height in centimeters. This is an example of:
A. dependent data.
B. duplicate data.
C. invalid data
D. redundant data
Correct Answer: D
Explanation: This is because redundant data is a type of data that is unnecessary or irrelevant for the analysis or purpose, which can affect the efficiency and performance of the analysis or process. Redundant data can be caused by having multiple data fields that store the same or similar information, such as patient height in inches and patient height in centimeters in this case. Redundant data can be eliminated or reduced by using data cleansing techniques, such as removing or merging the redundant data fields. The other types of data are not examples of data that is unnecessary or irrelevant for the analysis or purpose. Here is what they mean in terms of data quality:
Dependent data is a type of data that relies on or is influenced by another data field or value, such as a formula or a calculation that uses other data fields or values as inputs or outputs. Dependent data can be useful or important for the analysis or purpose, as it can provide additional information or insights based on the existing data. Duplicate data is a type of data that is repeated or copied in a data set, which can affect the quality and validity of the analysis or process. Duplicate data can be caused by having multiple records or rows that have the same or similar values for one or more data fields or columns, such as customer ID or order ID. Duplicate data can be eliminated or reduced by using data cleansing techniques, such as removing or filtering out the duplicate records or rows. Invalid data is a type of data that is incorrect or inaccurate in a data set, which can affect the validity and reliability of the analysis or process. Invalid data can be caused by having values that do not match the expected format, type, range, or rule for a data field or column, such as an email address that does not have an @ symbol or a date that does not follow the YYYY-MM-DD format. Invalid data can be eliminated or reduced by using data cleansing techniques, such as validating or correcting the invalid values.
Question 177:
A database consists of one fact table that is composed of multiple dimensions. Each dimension is represented by a denormalized table. This structure is an example of a:
A. non-relational schema.
B. galaxy schema.
C. snowflake schema.
D. star schema.
Correct Answer: D
Explanation: A star schema is a type of database schema that consists of one fact table and multiple dimension tables. The fact table contains the measures or metrics of the business process, such as sales, orders, or transactions. The dimension tables contain the attributes or characteristics of the business entities, such as products, customers, or locations. The fact table is connected to the dimension tables by foreign keys that reference the primary keys of the dimension tables. The fact table is located at the center of the schema, while the dimension tables are located at the edges, forming a star-like shape1. A star schema is an example of a denormalized schema, which means that the dimension tables are not normalized and may contain redundant or repeated data. This is done to improve the performance and simplicity of queries, as there are fewer joins and tables involved. A star schema is suitable for data warehouses and business intelligence applications that require fast and efficient data retrieval2.
Question 178:
What would be an example of an acceptable form of primary identification for the Data+ exam?
A. Passport.
B. School ID card.
C. Employee ID card.
D. Credit card with photo and signature.
Correct Answer: A
Question 179:
Which of the following database schemas features normalized dimension tables?
A. Flat
B. Snowflake
C. Hierarchical
D. Star
Correct Answer: B
Explanation: The correct answer is B. Snowflake.
A snowflake schema is a type of database schema that features normalized dimension tables. A database schema is a way of organizing and structuring the data in a database. A dimension table is a table that contains descriptive attributes or characteristics of the data, such as product name, category, color, etc. A normalized table is a table that follows the rules of normalization, which is a process of reducing data redundancy and improving data integrity by organizing the data into smaller and simpler tables12 A snowflake schema is a variation of the star schema, which is another type of database schema that features denormalized dimension tables. A denormalized table is a table that does not follow the rules of normalization, and may contain redundant or duplicated data. A star schema consists of a central fact table that contains quantitative measures or facts, such as sales amount, order quantity, etc., and several dimension tables that are directly connected to the fact table. A snowflake schema differs from a star schema in that the dimension tables are further split into sub-dimension tables, creating a snowflake-like shape13 A snowflake schema has some advantages and disadvantages over a star schema. Some advantages are: It reduces the storage space required for the dimension tables, as it eliminates the redundant data. It improves the data quality and consistency, as it avoids the update anomalies that may occur in denormalized tables. It allows more detailed analysis and queries, as it provides more levels of dimensions. Some disadvantages are: It increases the complexity and number of joins required to retrieve the data from multiple tables, which may affect the query performance and speed. It reduces the readability and simplicity of the schema, as it has more tables and relationships to understand. It may require more maintenance and administration, as it has more tables to manage and update13
Question 180:
Q3 2020 has just ended, and now a data analyst needs to create an ad-hoc sales report that demonstrates how well the Q3 2020 promotion went versus last year's Q3 promotion.
Which of the following date parameters should the analyst use?
A. 2019 vs. YTD 2020
B. Q3 2019 vs. Q3 2020
C. YTD 2019 vs. YTD 2020
D. Q4 2019 vs. Q3 2020
Correct Answer: B
Explanation: The date parameters that the analyst should use are Q3 2019 vs. Q3 2020, as this will allow the analyst to compare the sales performance of the Q3 2020 promotion with the same period of last year. This will help to eliminate any seasonal or cyclical effects that might affect the sales data. The other options are not relevant for this purpose, as they either compare different quarters or different years. Reference: CertMaster Practice for Data+ Exam Prep - CompTIA
Nowadays, the certification exams become more and more important and required by more and more enterprises when applying for a job. But how to prepare for the exam effectively? How to prepare for the exam in a short time with less efforts? How to get a ideal result and how to find the most reliable resources? Here on Vcedump.com, you will find all the answers. Vcedump.com provide not only CompTIA exam questions, answers and explanations but also complete assistance on your exam preparation and certification application. If you are confused on your DA0-001 exam preparations and CompTIA certification application, do not hesitate to visit our Vcedump.com to find your solutions here.