Exam Details
Exam Code
:PL-300Exam Name
:Microsoft Power BI Data AnalystCertification
:Microsoft CertificationsVendor
:MicrosoftTotal Questions
:400 Q&AsLast Updated
:Mar 28, 2025
Microsoft Microsoft Certifications PL-300 Questions & Answers
-
Question 151:
You have a Power Bl workspace that contains several reports.
You need to provide a user with the ability to create a dashboard that will use the visuals from the reports.
What should you do?
A. Grant the Read permission for the datasets to the user.
B. Add the user as a Viewer of the workspace.
C. Share the reports with the user.
D. Create a row-level security (RLS) role and add the user to the role.
E. Add the user as a member of the workspace.
-
Question 152:
You have the Power BI data model shown in the following exhibit.

The Sales table contains records of sales by day from the last five years up until today's date.
You plan to create a measure to return the total sales Of March 2021 when March 2022 is selected.
Which DAX expression should you use?
A. Calculate (Sum(Sales[Sales]), PREVIOUSYEAR( dimDate[Date])
B. TOTALYTD (SUM(Sales[Sales]), dimDate[Date] )
C. Calculate (SUM(Sales[Sales]), SAMEPERIODLASTYEAR(dimDate[Date] ))
D. SUM(Sales[Sales])
-
Question 153:
You have a Microsoft SharePoint Online site that contains several document libraries.
One of the document libraries contains manufacturing reports saved as Microsoft Excel files. All the manufacturing reports have the same data structure.
You need to load only the manufacturing reports to a table for analysis.
What should you do in Microsoft Power Bl Desktop?
A. Get data from a SharePoint Online folder, enter the site URL, and then select Combine and Load.
B. Get data from a SharePoint Online list and enter the site URL. Edit the query and filter by the path to the manufacturing reports library.
C. Get data from a SharePoint Online folder and enter the site URL. Edit the query and filter by the path to the manufacturing reports library.
D. Get data from a SharePoint Online list, enter the site URL, and then select Combine and Load.
-
Question 154:
Note: This question is a part of a series of questions that present the same scenario. For your convenience, the scenario is repeated in each question. Each question presents a different goal and answer choices, but the text of the scenario is
exactly the same in each question in this series.
Start of repeated scenario
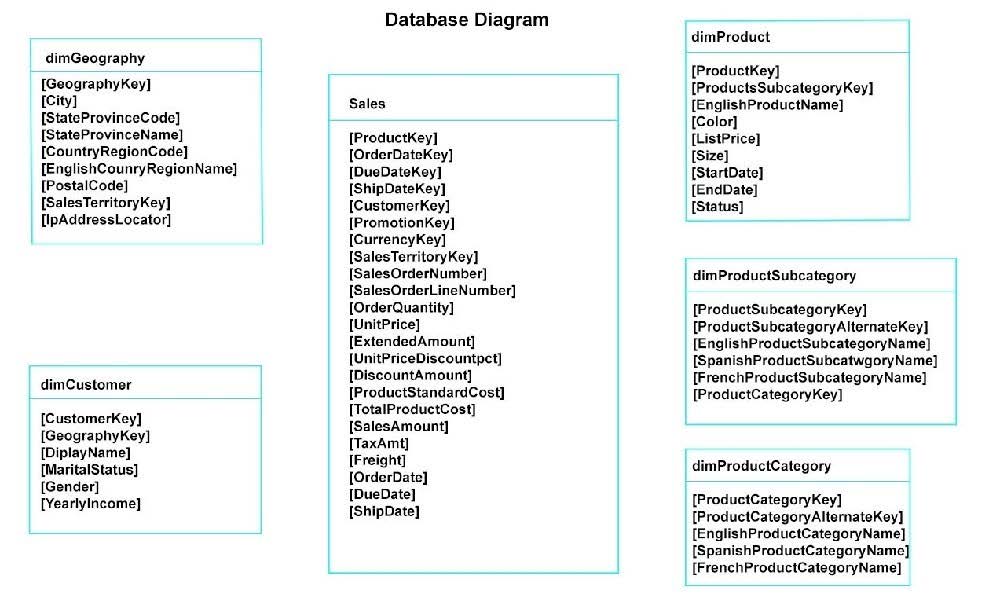
You have a Microsoft SQL Server database that has the tables shown in the Database Diagram exhibit. (Click the Exhibit.)

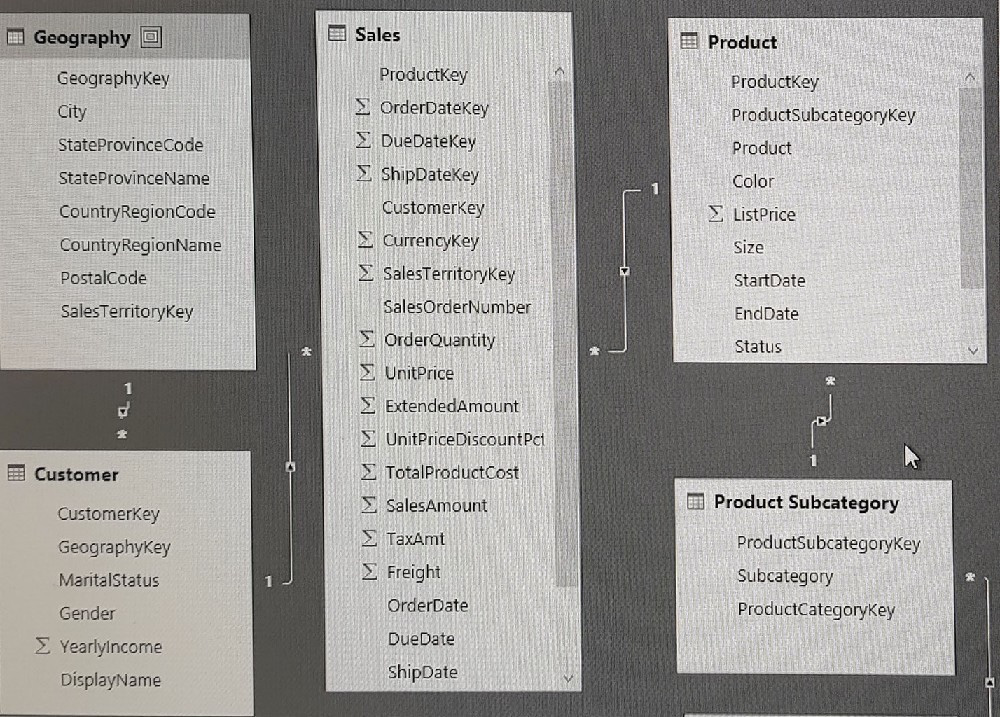
You plan to develop a Power BI model as shown in the Power BI Model exhibit. (Click the Exhibit).

You plan to use Power BI to import data from 2013 to 2015.
Product Subcategory [Subcategory] contains NULL values.
End of repeated scenario.
You implement the Power BI model.
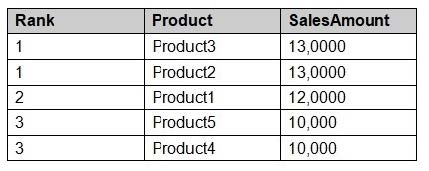
You need to add a measure to rank total sales by product. The results must appear as shown in the following table.

Which DAX formula should you use?
A. Product Ranking= RANKX (Product, [SalesAmount], , DESC, Skip)
B. Product Ranking= RANKX (ALL, (`Product'), [SalesAmount], , DESC, Dense)
C. Product Ranking= RANKX (ALL, (`Product'), [SalesAmount], , DESC, Skip)
D. Product Ranking= RANKX (ALL (`Product'), [SalesAmount], , Asc, Dense
-
Question 155:
You have a Power BI dashboard that displays different visualizations of company sales.
You enable QandA on the dashboard.
You need to provide users with sample questions that they can ask when using QandA.
Which settings should you modify from the Power BI Settings?
A. Subscriptions
B. Dashboards
C. Datasets
D. Workbooks
-
Question 156:
You import two Microsoft Excel tables named Customer and Address into Power Query. Customer contains the following columns:
1.
Customer ID
2.
Customer Name
3.
Phone
4.
Email Address
5.
Address ID
Address contains the following columns:
1.
Address ID
2.
Address Line 1
3.
Address Line 2
4.
City
5.
State/Region
6.
Country
7.
Postal Code
The Customer ID and Address ID columns represent unique rows.
You need to create a query that has one row per customer. Each row must contain City, State/Region, and Country for each customer.
What should you do?
A. Merge the Customer and Address tables.
B. Transpose the Customer and Address tables.
C. Group the Customer and Address tables by the Address ID column.
D. Append the Customer and Address tables.
-
Question 157:
You have a Power Bl report
You have a table named Dalai that contains 10 million rows. Data is used in the following visuals:
1.
A card that shows the number of records
2.
A bar chart that snows total transaction amount by territory
3.
A scatter plot that shows transaction amount and profit amount on the axes and points colored by territory You need to modify the scatter plot to make it easier for users to identify meaningful patterns. The solution must not affect the accuracy of the other visuals What should you do?
A. Apply a row filter to the Dalai query in Power Query Editor.
B. Add a trend line to the scatter plot
C. Enable high-density sampling on the scatter plot
D. Add a count field of the transaction amount to the size bucket of the scatter plot
-
Question 158:
You have more than 100 published datasets.
Ten of the datasets were verified to meet your corporate quality standards.
You need to ensure that the 10 verified datasets appear at the top of the list of published datasets whenever users search for existing datasets.
What should you do?
A. Publish the datasets in an app.
B. Promote the datasets.
C. Feature the dataset on the home page.
D. Certify the datasets.
-
Question 159:
You attempt to connect Purer 81 Desktop to a Cassandra database.
From the Get Data connector list you discover that there is no specific connector for the Cassandra database, You need to select an alternate data connector that will connect to the database.
Which of connector should you choose?
A. Microsoft SQL Server database
B. ODBC
C. OData
D. OLE DB
-
Question 160:
You have a CSV file that contains user complaints. The file contains a column named Logged logged contains the date and time each complaint occurred. The data in Logged is m the following format: 2018-12-31 at 08:59.
You need to be able to analyze the complaints by the logged date and use a built-in date hierarchy.
What should you do?
A. Create a column by example that starts with 2018-12-31.
B. Create a column by example that starts with 2018-12-31 and set the data type of the new column to Date
C. Apply the parse function from the Date transformations options to the Logged column.
D. Add a conditional column that outputs 2018 if the Logged column starts with 2018 and set the data type of the new column to Whole Number.
Related Exams:
62-193
Technology Literacy for Educators70-243
Administering and Deploying System Center 2012 Configuration Manager70-355
Universal Windows Platform – App Data, Services, and Coding Patterns77-420
Excel 201377-427
Excel 2013 Expert Part One77-725
Word 2016 Core Document Creation, Collaboration and Communication77-726
Word 2016 Expert Creating Documents for Effective Communication77-727
Excel 2016 Core Data Analysis, Manipulation, and Presentation77-728
Excel 2016 Expert: Interpreting Data for Insights77-731
Outlook 2016 Core Communication, Collaboration and Email Skills
Tips on How to Prepare for the Exams
Nowadays, the certification exams become more and more important and required by more and more enterprises when applying for a job. But how to prepare for the exam effectively? How to prepare for the exam in a short time with less efforts? How to get a ideal result and how to find the most reliable resources? Here on Vcedump.com, you will find all the answers. Vcedump.com provide not only Microsoft exam questions, answers and explanations but also complete assistance on your exam preparation and certification application. If you are confused on your PL-300 exam preparations and Microsoft certification application, do not hesitate to visit our Vcedump.com to find your solutions here.