Exam Details
Exam Code
:PL-300Exam Name
:Microsoft Power BI Data AnalystCertification
:Microsoft CertificationsVendor
:MicrosoftTotal Questions
:400 Q&AsLast Updated
:Mar 28, 2025
Microsoft Microsoft Certifications PL-300 Questions & Answers
-
Question 41:
You are reviewing a query that produces 10,000 rows in the Power Query Editor.
You need to identify whether a column contains only unique values.
Which two Data Preview options can you use? Each correct answer presents a complete solution.
NOTE: Each correct selection is worth one point.
A. Column profile
B. Column distribution
C. Show whitespace
D. Column quality
E. Monospace
-
Question 42:
You plan to create the chart shown in the following exhibit.
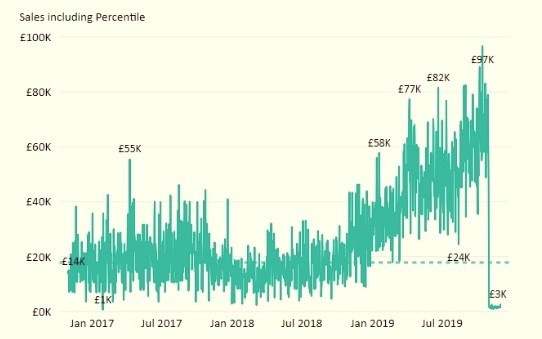
How should you create the dashed horizontal line denoting the 40th percentile of daily sales for the period shown?
A. Create a horizontal line that has a fixed value of 24,000.
B. Add a measure to the visual that uses the following DAX expression. Heasurel - PERCENTUEX.EXC (Sales,Sales[Total Sales],?40)
C. Add a new percentile line that uses Total Sales as the measure and 40% as the percentile.
D. Add a measure to the visual that uses the following DAX expression. Heasurel = PERCENTILEX.INC (Sales,Sales[Total Sales],6.40)
-
Question 43:
You are configuring a Microsoft Power Bl data model to enable users to ask natural language questions by using QandA. You have a table named Customer that has the following measure.
Customer Count = DISTINCTCOUNT(Customer[CustomerID])
Users frequently refer to customers as subscribers.
You need to ensure that the users can get a useful result for "subscriber count" by using QandA. The solution must minimize the size of the model.
What should you do?
A. Add a description of "subscriber count" to the Customer Count measure.
B. Set Summarize By to None for the CustomerlD column.
C. Add a description of "Subscriber" to the Customer table.
D. Add a synonym of "subscriber" to the Customer table.
-
Question 44:
You have the following three versions of an Azure SQL database:
1.
Test
2.
Production
3.
Development
You have a dataset that uses the development database as a data source.
You need to configure the dataset so that you can easily change the data source between the development, test, and production database servers from powerbi.com.
Which should you do?
A. Create a JSON file that contains the database server names. Import the JSON file to the dataset.
B. Create a parameter and update the queries to use the parameter.
C. Create a query for each database server and hide the development tables.
D. Set the data source privacy level to Organizational and use the ReplaceValue Power Query M function.
-
Question 45:
Note: This question is part of a series of questions that present the same scenario. Each question in the series contains a unique solution that might meet the stated goals. Some question sets might have more than one correct solution, while
others might not have a correct solution.
After you answer a question in this section, you will NOT be able to return to it. As a result, these questions will not appear in the review screen.
You have a Microsoft Excel workbook that is saved to Microsoft SharePoint Online. The workbook contains several Power View sheets.
You need to recreate the Power View sheets as reports in the Power Bl service.
Solution: From the Power Bl service, get the data from SharePoint Online, and then click Connect
Does this meet the goal?
A. Yes
B. No
-
Question 46:
You have sales data in a star schema that contains four tables named Sales, Customer, Date, and Product. The Sales table contains purchase and ship dates.
Most often, you will use the purchase date to analyze the data, but you will analyze the data by both dates independently and together.
You need to design an imported dataset to support the analysis. The solution must minimize the model size and the number of queries against the data source.
Which data modeling design should you use?
A. Use the Auto Date/Time functionality in Microsoft Power Bl and do NOT import the Date table.
B. Duplicate the Date query in Power Query and create active relationships between Sales and both Date tables in the modeling view.
C. On the Date table, use a reference query in Power Query and create active relationships between Sales and both Date tables in the modeling view.
D. Import the Date table twice in Power Query and create active relationships between Sales and both Date tables in the modeling view.
-
Question 47:
You build a report to analyze customer transactions from a database that contains the tables shown in the following table.
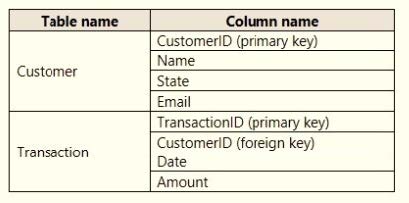
You import the tables.
Which relationship should you use to link the tables?
A. one-to-many from Customer to Transaction
B. one-to-one between Customer and Transaction
C. one-to-many from Transaction to Customer
D. many-to-many between Customer and Transaction
-
Question 48:
Note: This question is part of a series of questions that present the same scenario. Each question in the series contains a unique solution that might meet the stated goals. Some question sets might have more than one correct solution, while
others might not have a correct solution.
After you answer a question in this section, you will NOT be able to return to it. As a result, these questions will not appear in the review screen.
From Power Query Editor, you profile the data shown in the following exhibit.
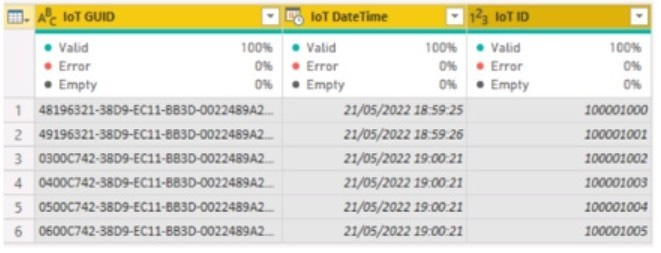
The IOT ID columns are unique to each row in query.
You need to analyze 10T events by the hour and day of the year. The solution must improve dataset performance.
Solution: You change the IOT DateTime column to the Date data type.
Does this meet the goal?
A. Yes
B. No
-
Question 49:
You have a Power Bl workspace named Workspace1 that contains a dataset named DS1 and a report named RPT1.
A user wants to create a report by using the data In DS1 and publish the report to another workspace.
You need to provide the user with the appropriate access. The solution must minimize the number of access permissions granted to the user.
What should you do?
A. Share RPT1 with the user.
B. Add the user as a Viewer of Workspace1.
C. Add the user as a member of Workspace1.
D. Grant the Build permission for DS1 to the user.
-
Question 50:
You are creating a report in Power BI Desktop.
You load a data extract that includes a free text field named coll.
You need to analyze the frequency distribution of the string lengths in col1. The solution must not affect the size of the model.
What should you do?
A. In the report, add a DAX calculated column that calculates the length of col1
B. In the report, add a DAX function that calculates the average length of col1
C. From Power Query Editor, add a column that calculates the length of col1
D. From Power Query Editor, change the distribution for the Column profile to group by length for col1


Related Exams:
62-193
Technology Literacy for Educators70-243
Administering and Deploying System Center 2012 Configuration Manager70-355
Universal Windows Platform – App Data, Services, and Coding Patterns77-420
Excel 201377-427
Excel 2013 Expert Part One77-725
Word 2016 Core Document Creation, Collaboration and Communication77-726
Word 2016 Expert Creating Documents for Effective Communication77-727
Excel 2016 Core Data Analysis, Manipulation, and Presentation77-728
Excel 2016 Expert: Interpreting Data for Insights77-731
Outlook 2016 Core Communication, Collaboration and Email Skills
Tips on How to Prepare for the Exams
Nowadays, the certification exams become more and more important and required by more and more enterprises when applying for a job. But how to prepare for the exam effectively? How to prepare for the exam in a short time with less efforts? How to get a ideal result and how to find the most reliable resources? Here on Vcedump.com, you will find all the answers. Vcedump.com provide not only Microsoft exam questions, answers and explanations but also complete assistance on your exam preparation and certification application. If you are confused on your PL-300 exam preparations and Microsoft certification application, do not hesitate to visit our Vcedump.com to find your solutions here.