Exam Details
Exam Code
:PL-300Exam Name
:Microsoft Power BI Data AnalystCertification
:Microsoft CertificationsVendor
:MicrosoftTotal Questions
:400 Q&AsLast Updated
:Mar 28, 2025
Microsoft Microsoft Certifications PL-300 Questions & Answers
-
Question 81:
You build a Power Bi report that displays loT temperature data streaming from a refrigerator.
You publish the report to the Power BI service.
You need to be notified when the temperature rises above four degrees Celsius.
What should you do?
A. Set an alert on a KPI visual in the report.
B. Pin a card visual to a dashboard and create a subscription.
C. Pin a card visual to a dashboard and set an alert on the tile.
D. Pin a report page to a dashboard and set an alert on the page.
-
Question 82:
You have a data model that contains many complex DAX expressions. The expressions contain frequent references to the RELATED and RELATEDTABLE functions.
You need to recommend a solution to minimize the use of the RELATED and RELATEDTABLE functions.
What should you recommend?
A. Merge tables by using Power Query.
B. Hide unused columns in the model.
C. Split the model into multiple models.
D. Transpose.
-
Question 83:
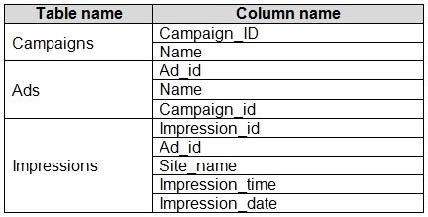
You have the tables shown in the following table.

The Impressions table contains approximately 30 million records per month.
You need to create an ad analytics system to meet the following requirements:
Present ad impression counts for the day, campaign, and Site_name. The analytics for the last year are required.
Minimize the data model size.
Which two actions should you perform? Each correct answer presents part of the solution.
NOTE: Each correct selection is worth one point.
A. Group the impressions by Ad_id, Site_name, and Impression_date.Aggregate by using the CountRows function.
B. Create one-to-many relationships between the tables.
C. Create a calculated measure that aggregates by using the COUNTROWS function.
D. Create a calculated table that contains Ad_id, Site_name, and Impression_date.
-
Question 84:
Note: This question is part of a series of questions that present the same scenario. Each question in the series contains a unique solution that might meet the stated goals. Some question sets might have more than one correct solution, while
others might not have a correct solution.
After you answer a question in this section, you will NOT be able to return to it. As a result, these questions will not appear in the review screen.
You create a parameter named DataSourceExcel that holds the file name and location of a Microsoft Excel data source.
You need to update the query to reference the parameter instead of multiple hard-coded copies of the location within each query definition.
Solution: You modify the source step of the queries to use DataSourceExcel as the file path.
Does this meet the goal?
A. Yes
B. No
-
Question 85:
You have a table that contains sales data and approximately 1,000 rows.
You need to identify outliers in the table. Which type of visualization should you use?
A. area chart
B. donut chart
C. scatter plot
D. pie chart
-
Question 86:
You have a Microsoft Power BI report. The size of PBIX file is 550 MB. The report is accessed by using an App workspace in shared capacity of powerbi.com.
The report uses an imported dataset that contains one fact table. The fact table contains 12 million rows. The dataset is scheduled to refresh twice a day at 08:00 and 17:00.
The report is a single page that contains 15 AppSource visuals and 10 default visuals.
Users say that the report is slow to load the visuals when they access and interact with the report.
You need to recommend a solution to improve the performance of the report.
What should you recommend?
A. Increase the number of times that the dataset is refreshed.
B. Split the visuals onto multiple pages.
C. Change the imported dataset to DirectQuery.
D. Implement row-level security (RLS).
-
Question 87:
You have a Microsoft Power Bl report. The size of PBIX file is 550 MB. The report is accessed by using an App workspace in shared capacity of powerbi.com.
The report uses an imported dataset that contains one fact table. The fact table contains 12 million rows. The dataset is scheduled to refresh twice a day at 08:00 and 17:00.
The report is a single page that contains 15 custom visuals and 10 default visuals.
Users say that the report is slow to load the visuals when they access and interact with the report
You need to recommend a solution to improve the performance of the report.
What should you recommend?
A. Replace the default visuals with AppSource visuals.
B. Change any DAX measures to use iterator functions.
C. Remove unused columns from tables in the data model.
D. Increase the number of times that the dataset is refreshed
-
Question 88:
You have a Microsoft Power BI data model that contains three tables named Orders, Date, and City. There is a one-to-many relationship between Date and Orders and between City and Orders.
The model contains two row-level security (RLS) roles named Role1 and Role2. Role1 contains the following filter.
City[State Province] = "Kentucky"
Role2 contains the following filter.
Date[Calendar Year] = 2020
If a user is a member of both Role1 and Role2, what data will they see in a report that uses the model?
A. The user will see data for which the State Province value is Kentucky and the Calendar Year is 2020.
B. The user will see data for which the State Province value is Kentucky or the Calendar Year is 2020.
C. The user will see only data for which the State Province value is Kentucky.
D. The user will receive an error and will not be able to see the data in the report.
-
Question 89:
Your company has employees in 10 states.
The company recently decided to associate each state to one of the following three regions: East, West, and North.
You have a data model that contains employee information by state. The model does NOT include region information.
You have a report that shows the employees by state.
You need to view the employees by region as quickly as possible.
What should you do?
A. Create a new aggregation that summarizes by employee.
B. Create a new group on the state column and set the Group type to List.
C. Create a new group on the state column and set the Group type to Bin.
D. Create a new aggregation that summarizes by state.
-
Question 90:
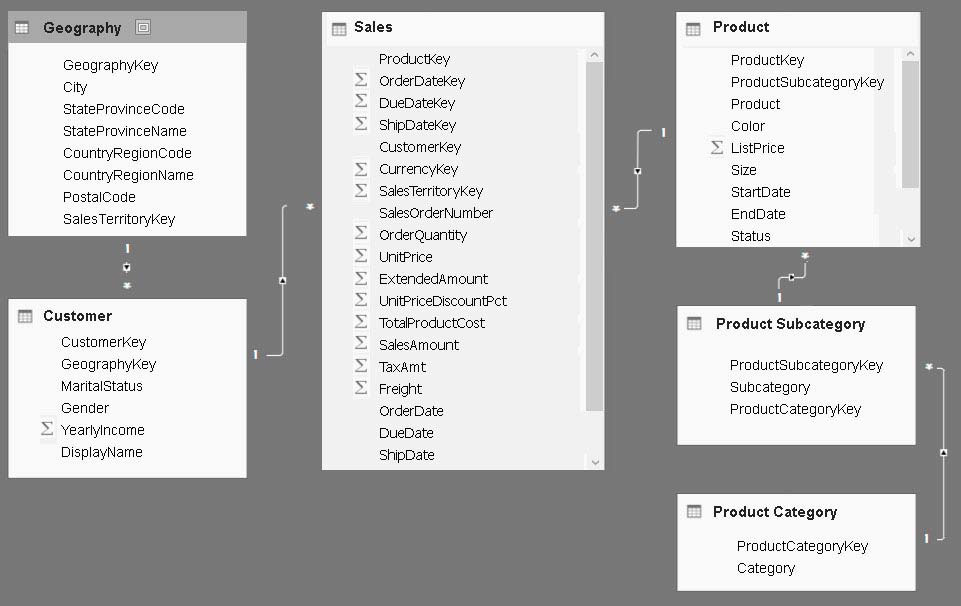
You are creating a sales report in Power Bl for the NorthWest region sales territory of your company. Data will come from a view in a Microsoft SQL Server database. A sample of the data is shown in the following table:

The report will facilitate the following analysis:
1.
The count of orders and the sum of total sales by Order Date
2.
The count of customers who placed an order
3.
The average quantity per order
You need to reduce data refresh times and report query times.
Which two actions should you perform? Each correct answer presents part of the solution
NOTE: Each correct selection is worth one point.
A. Set the data type for SalesOrderNumber to Decimal Number.
B. Remove the CustomerKey and ProductKey columns.
C. Remove the TaxAmt and Freight columns.
D. Filter the data to only the NorthWest region sales territory.
Related Exams:
62-193
Technology Literacy for Educators70-243
Administering and Deploying System Center 2012 Configuration Manager70-355
Universal Windows Platform – App Data, Services, and Coding Patterns77-420
Excel 201377-427
Excel 2013 Expert Part One77-725
Word 2016 Core Document Creation, Collaboration and Communication77-726
Word 2016 Expert Creating Documents for Effective Communication77-727
Excel 2016 Core Data Analysis, Manipulation, and Presentation77-728
Excel 2016 Expert: Interpreting Data for Insights77-731
Outlook 2016 Core Communication, Collaboration and Email Skills
Tips on How to Prepare for the Exams
Nowadays, the certification exams become more and more important and required by more and more enterprises when applying for a job. But how to prepare for the exam effectively? How to prepare for the exam in a short time with less efforts? How to get a ideal result and how to find the most reliable resources? Here on Vcedump.com, you will find all the answers. Vcedump.com provide not only Microsoft exam questions, answers and explanations but also complete assistance on your exam preparation and certification application. If you are confused on your PL-300 exam preparations and Microsoft certification application, do not hesitate to visit our Vcedump.com to find your solutions here.