Exam Details
Exam Code
:TDS-C01Exam Name
:Tableau Certified Desktop SpecialistCertification
:Tableau CertificationsVendor
:TableauTotal Questions
:341 Q&AsLast Updated
:Apr 16, 2025
Tableau Tableau Certifications TDS-C01 Questions & Answers
-
Question 121:
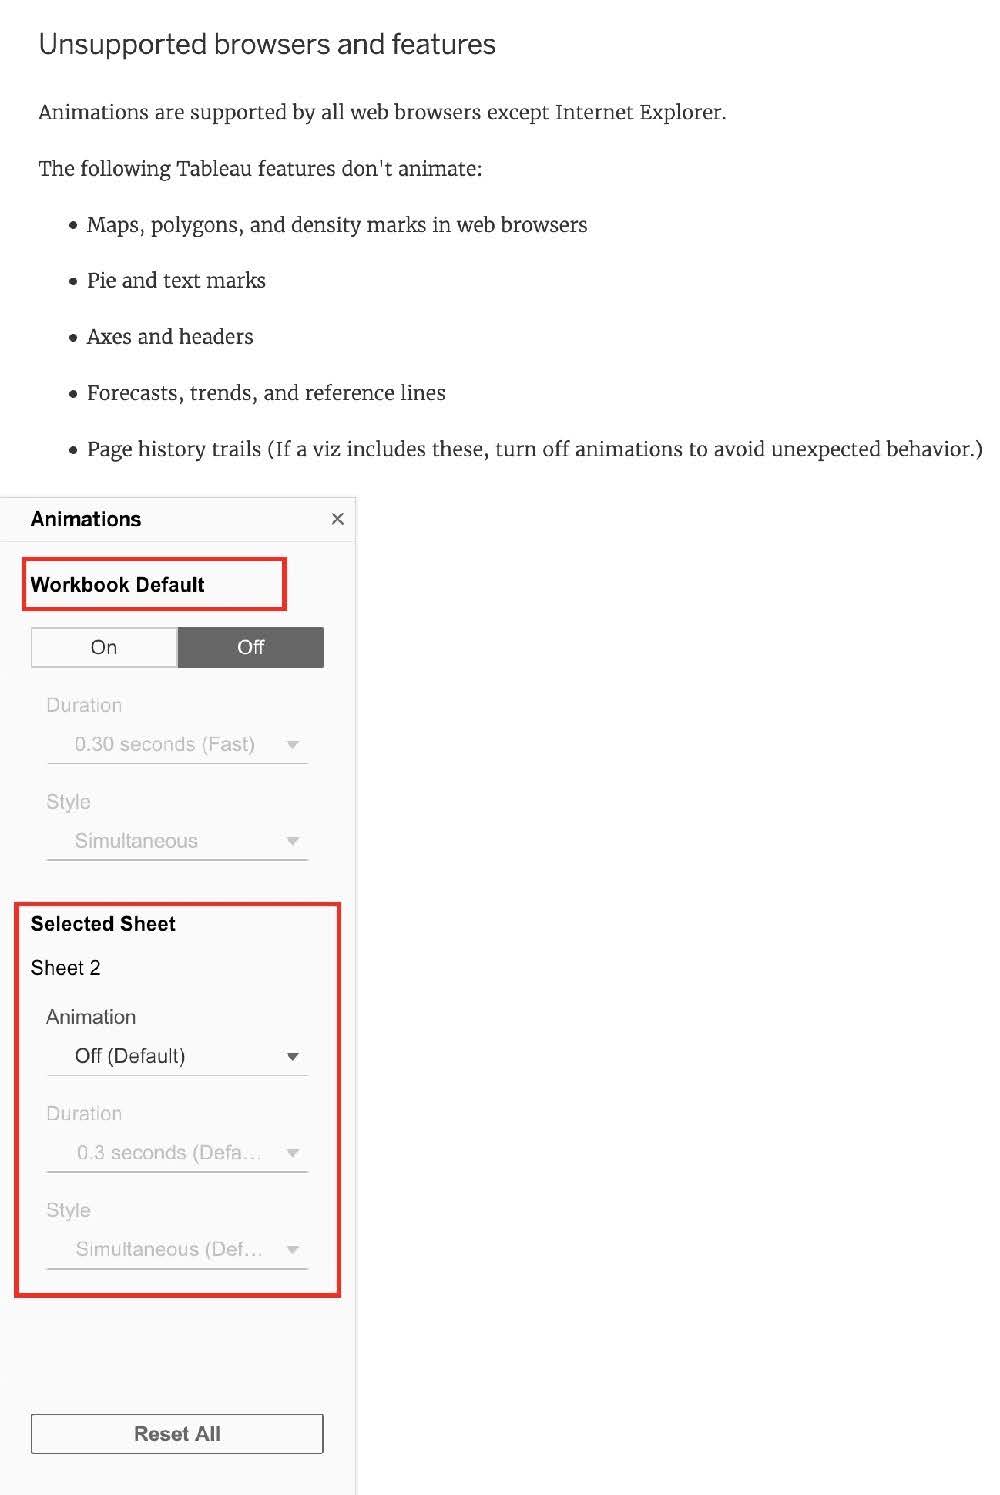
Which of the following points are True about Viz Animations?
A. Sequential animations take more time but make complex changes clearer by presenting them step-by-step
B. They can be turned on for certain worksheets only
C. Animations work well with maps, polygons, and density marks in web browsers
D. It is possible to turn them on for the entire workbook at once
-
Question 122:
The default path for all supporting files, data sources, icons, logs etc is in ______________________
A. Documents-> Tableau Files
B. Documents-> Tableau
C. Documents-> My Tableau Repository
D. Downloads-> Tableau Support Files
-
Question 123:
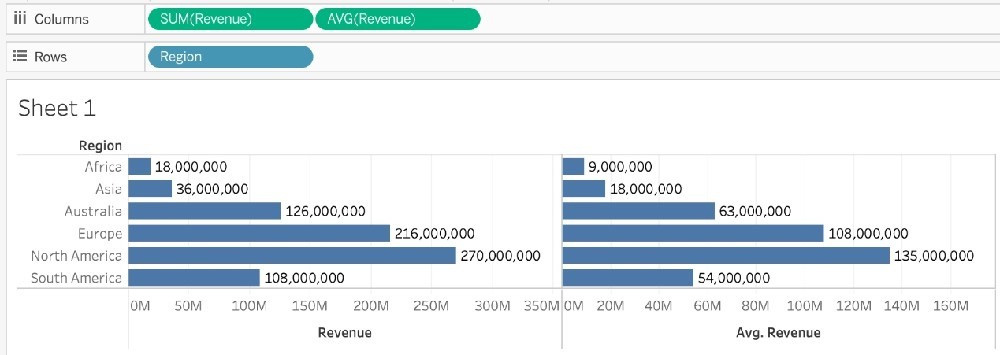
Is it possible to use measures in the same view multiple times (e.g. SUM of the measure and AVG of the measure)?
A. Yes
B. No
-
Question 124:
By default, measures placed in a view are aggregated. The type of aggregation applied ______________
A. is always sum
B. depends on the context of the view
C. is always COUNT
D. is always AVERAGE
-
Question 125:
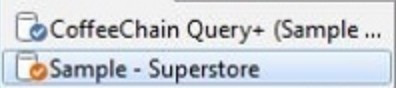
When using a Blend, what is the color of tick-mark on the primary and secondary data sources respectively?
A. Red, Blue
B. Orange, Blue
C. Blue, Red
D. Blue, Orange
-
Question 126:
What will the following function return? LEFT("Tableau", 3)
A. An error
B. Tab
C. eau
D. ble
-
Question 127:
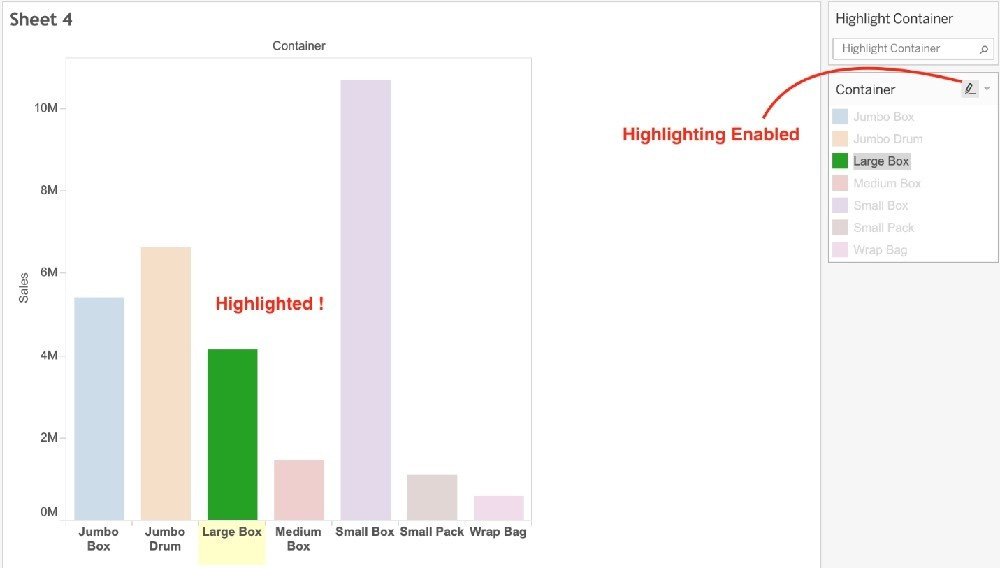
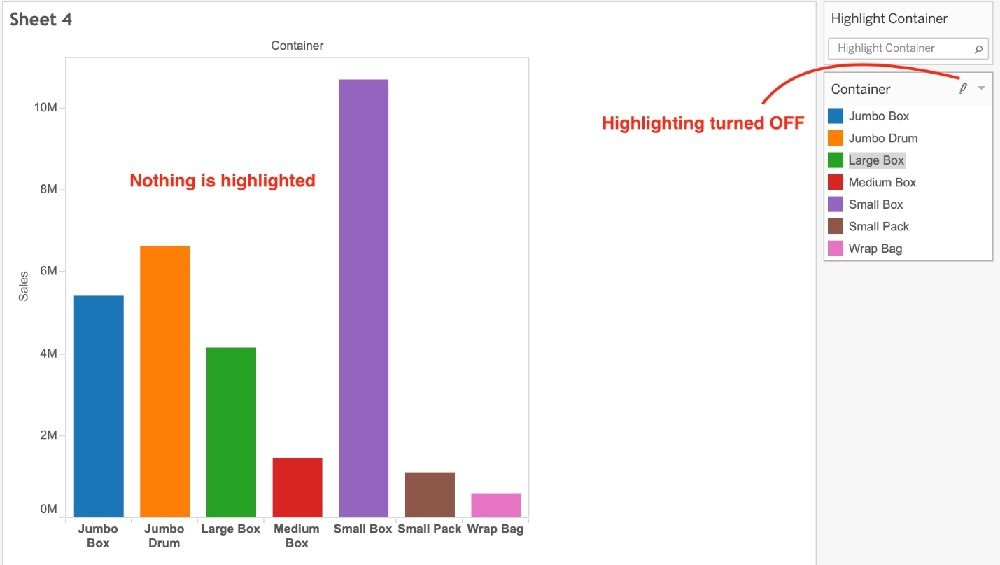
What does the following marker/icon do in Tableau?
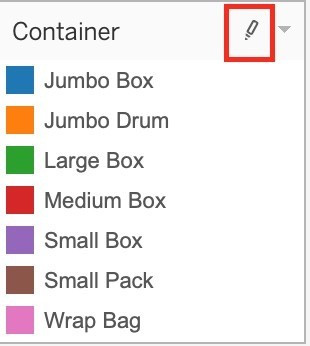
A. Format the Legends
B. Edit the Colors
C. Toggle the highlighting on/off.
D. Highlight the largest value
-
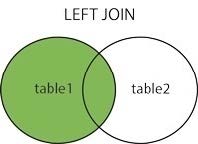
Question 128:
True or False: LEFT JOIN returns all rows from the left table, with the matching rows in the right table
A. True
B. False
-
Question 129:
The row and column shelves contain ___________________
A. Pills
B. Grand Totals
C. Filters
D. Parameters
-
Question 130:
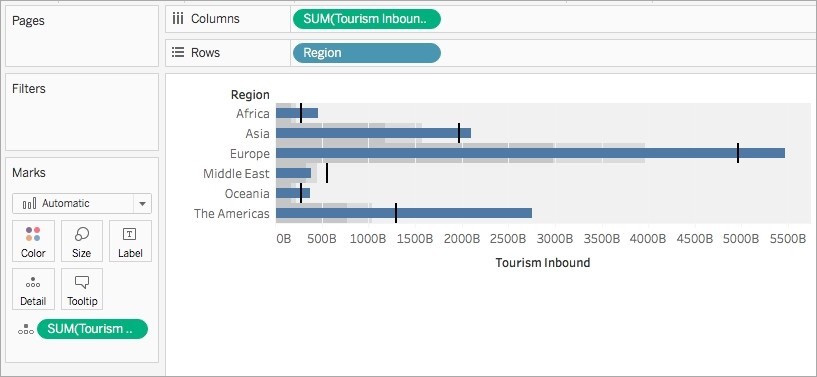
Which of the following is a good reason for using a bullet graph?
A. Comparing the actual sales against the target sales
B. Analysing the trend over a given time period
C. Forecasting future sales
D. Displaying the year-on-year growth in sales

Tips on How to Prepare for the Exams
Nowadays, the certification exams become more and more important and required by more and more enterprises when applying for a job. But how to prepare for the exam effectively? How to prepare for the exam in a short time with less efforts? How to get a ideal result and how to find the most reliable resources? Here on Vcedump.com, you will find all the answers. Vcedump.com provide not only Tableau exam questions, answers and explanations but also complete assistance on your exam preparation and certification application. If you are confused on your TDS-C01 exam preparations and Tableau certification application, do not hesitate to visit our Vcedump.com to find your solutions here.