A development team responsible for the front-end shopping application has asked to receive an email every time the Java container thread count exceeds 25. Which alert and response capabilities settings will provide the email?
A. Node Health-JMX Thread Pools (> Specific Value) + Notification Action (Send an Email)
B. Node Health-Thread Pools (> Specific Value) + Notification Action (Send an Email)
C. Node Health-Thread Pools (> Specific Value) + Notification Action (Custom Action)
D. Node Health-JMX Thread Pools (> Baseline) + Notification Action (Send an Email)
Correct Answer: B
In AppDynamics, you can create health rules to monitor various metrics and set up actions based on the thresholds defined for these metrics. For monitoring Java container thread counts, you can set a health rule based on Node Health-
specifically on thread pools-to trigger when the thread count exceeds a specific value. The Notification Action can then be configured to send an email to the development team whenever this threshold is breached.
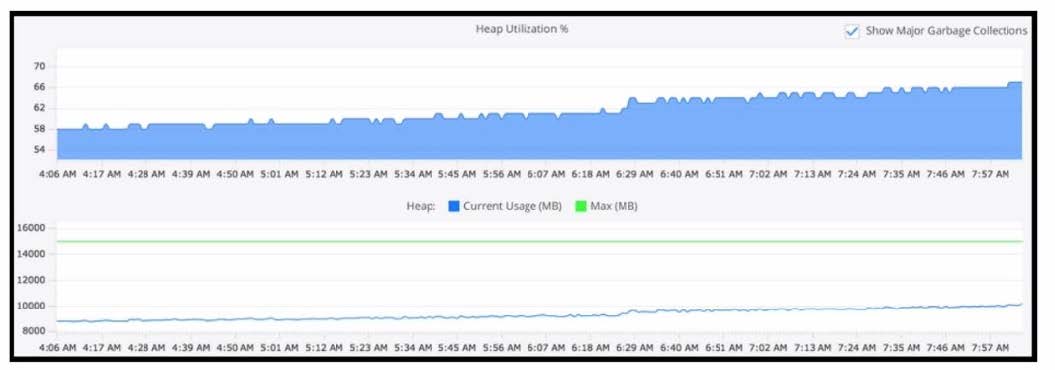
Using this heap utilization graph, which method is used to confirm if a memory leak is occurring during a certain time frame?
A. In metric browser go through Application Infrastructure > Hardware Resources and select Memory Total (MB) and Used (MB)
B. Refer to the Tiers and Nodes section and into the Memory tab and visualize Heap Utilization (%) and Heap Current Usage (MB) Vs Max (MB)
C. Refer to the Tiers and Nodes section and into the JMX tab and select JVM > Memory > Heap > Max Available (MB) and Current usage (MB)
D. In metric browser go through Application Infrastructure > Hardware Resources > Memory Total (MB) and Swap Used (MB)
Correct Answer: B
To confirm if a memory leak is occurring, one should refer to the Tiers and Nodes section of the AppDynamics Controller UI, navigate to the Memory tab, and observe the Heap Utilization over time in relation to the Heap's Current Usage (MB) versus the Maximum (MB) allocated. Consistent growth in heap utilization or an upward trend that does not decrement even after garbage collection indicates a potential memory leak.
References:AppDynamics documentation on Memory Leak Detection and Heap Analysis.
Question 13:
Which two Key Performance Indicators (KPIs) accurately provide insight into server level resource consumption? (Choose two.)
A. Calls per Minute
B. Availability
C. Average Response Time
D. Application Restarts
E. CPU %Busy
F. Memory Used%
Correct Answer: EF
Key Performance Indicators (KPIs) such as "CPU %Busy" and "Memory Used%" are critical for providing insights into server-level resource consumption. "CPU %Busy" indicates the percentage of time the CPU is actively working on
processes, reflecting the server's processing workload. "Memory Used%" shows the proportion of memory utilized, indicating how much of the server's RAM is being consumed by applications and processes. These KPIs are essential for
understanding and managing server performance and resource allocation.
References:
AppDynamics documentation on Server Monitoring: Includes information on monitoring server-level metrics, including CPU and memory utilization, to assess resource consumption.
Question 14:
Which two statements are correct about creating Information Points? (Choose two.)
A. A wildcard can be used to select multiple methods for an Information Point.
B. A wildcard can be used to select multiple classes for an Information Point.
C. An Information Point can be created on the same class and method as a Custom Exit Point.
D. An Information Point can be created on a class and method that is executed before the Business Transaction entry point.
Correct Answer: AB
When creating Information Points in AppDynamics, wildcards can be utilized to select multiple methods or classes, thereby broadening the scope of data collection. This feature is particularly useful for monitoring similar operations across
different components of an application, enabling a more efficient and scalable approach to gathering custom metrics.
References:
AppDynamics documentation on Information Points: Elaborates on the process of setting up Information Points, including the use of wildcards to capture metrics from multiple methods or classes.
Question 15:
What AppDynamics Alert Action does a Performance Analyst need to select to post an AppDynamics event to a third-party collaboration tool?
A. Make an HTTP Request
B. Take a thread dump
C. Create or Update a JIRA Ticket
D. Run a script or executable on problematic nodes
Correct Answer: A
To post an AppDynamics event to a third-party collaboration tool, the Performance Analyst needs to select the "Make an HTTP Request" alert action. This action allows AppDynamics to send an HTTP request to a specified URL, which can be
the endpoint provided by the third-party tool's API. This integration capability enables the automatic posting of events, alerts, and notifications from AppDynamics to collaboration tools, enhancing communication and response times to
performance issues.
References:
AppDynamics documentation on Alert and Respond: Details the various alert actions available within AppDynamics, including the ability to make HTTP requests to integrate with external systems.
Question 16:
How does a Performance Analyst identify if automatic remediation has been taken for a health rule violation?
A. Expand on the "Description" field to display "Actions Executed".
B. Review the "Application Dashboard" and review "Actions Executed"
C. Right-click on "view details" and click on the "Actions Executed" button.
D. Click on the link inside the Health Rule field and look for the "Affects" tab to display the Executed Actions.
Correct Answer: A
To identify if automatic remediation actions have been taken for a health rule violation in AppDynamics, a Performance Analyst should expand the "Description" field of the health rule violation event. This section will provide details on the actions executed as part of the automatic remediation process. These details help analysts understand the steps taken by the system to mitigate the issue without manual intervention.References:AppDynamics documentation on Health Rule Violations and Automated Actions.
Question 17:
Which feature can be used to determine if a given Java class is visible in AppDynamics?
A. Tools in Business Transaction Discovery Session
B. Preview Business transactions in Business Transaction Discovery Session
C. Use the thread dump feature on the node agent
D. Use the object instance tracking feature in memory
Correct Answer: B
To determine if a given Java class is visible in AppDynamics, the "Preview Business transactions" feature in a Business Transaction Discovery Session can be used. This feature allows users to validate and preview the detection of business
transactions, which includes ensuring that specific Java classes and methods are being correctly identified and monitored by AppDynamics.
References:
AppDynamics documentation on Business Transaction Detection: Explains how to conduct a Business Transaction Discovery Session and use the preview feature to validate the visibility and detection of business transactions, including specific Java classes.
Question 18:
A Performance Analyst is reviewing Business Transactions with an Application team. The Application team would like to increase the Application Business Transaction limit because they need to have visibility into all the different transactions. What should the Performance Analyst do?
A. Do nothing since the limit is not important during configuration
B. Increase the limit to the requested value
C. Increase the limit half way between the current level and the requested value
D. Focus on the Business Transactions exceeding the limit and why
Correct Answer: D
When an application team requests an increase in the Application Business Transaction limit for visibility purposes, it's crucial for the Performance Analyst to focus on the transactions that are currently exceeding the limit and understand why.
This approach helps in identifying whether the limit is being reached due to genuinely essential transactions or if there are redundant, irrelevant, or improperly defined transactions contributing to the limit breach. By analyzing and rationalizing
the transactions, the analyst can ensure that only valuable transactions are monitored, optimizing resource usage and maintaining effective observability without necessarily increasing the limit.
References:
AppDynamics documentation on Business Transaction Limits: Discusses the implications of business transaction limits and strategies for managing and optimizing these limits within AppDynamics.
AppDynamics Best Practices Guide: Offers recommendations for configuring and managing business transactions, including handling limits and ensuring meaningful transaction monitoring.
Question 19:
Which statement about Service End Points and Business Transactions is true?
A. Service End Points and Business Transactions can both be renamed by right clicking and selecting 'rename'.
B. Service End Points and Business Transactions can both configure data collectors.
C. Service End Points and Business Transactions can both be split.
D. Service End Points and Business Transactions both provide percentile metrics.
Correct Answer: B
Both Service Endpoints and Business Transactions in AppDynamics have the capability to configure data collectors. Data collectors are used to gather detailed information about transactions or endpoints, such as method parameters, return values, and SQL statements. References: AppDynamics documentation on Data Collectors https://docs.appdynamics.com/latest/en/application-monitoring/configure-data-collection
Question 20:
Which three data points can be located by drilling down into a JDBC exit call for an Oracle backend? (Choose three.)
A. Query type
B. Statement type
C. Query Id
D. Weight %
E. Originating node
F. %Time
Correct Answer: ABE
When drilling down into a JDBC exit call for an Oracle backend, AppDynamics provides detailed information about the call. The data points include:
Query type, which can indicate whether it's a SELECT, INSERT, UPDATE, or DELETE statement.
Statement type, which describes the nature of the SQL statement being executed. Originating node, which identifies the node from which the JDBC call originated. These data points help in understanding the nature and source of database
operations, which can be critical for performance analysis and troubleshooting.
Nowadays, the certification exams become more and more important and required by more and more enterprises when applying for a job. But how to prepare for the exam effectively? How to prepare for the exam in a short time with less efforts? How to get a ideal result and how to find the most reliable resources? Here on Vcedump.com, you will find all the answers. Vcedump.com provide not only Cisco exam questions, answers and explanations but also complete assistance on your exam preparation and certification application. If you are confused on your 500-420 exam preparations and Cisco certification application, do not hesitate to visit our Vcedump.com to find your solutions here.