Developers and operations personnel complain the Controller tracks many irrelevant Java classes and methods. How does a Performance Analyst exclude this unhelpful information?
A. Configuration > Baselines and create a new dynamic baseline
B. Edit the mbeans-server.xml file to delete the irrelevant methods
C. Configuration > Instrumentation > Call Graph Settings and exclude irrelevant packages
D. Edit the controller-info.xml file to exclude irrelevant methods
Correct Answer: C
To streamline the monitoring process and enhance the relevance of collected data, AppDynamics allows Performance Analysts to exclude certain Java classes and methods from instrumentation. This is done through the "Configuration >
Instrumentation > Call Graph Settings" menu, where irrelevant packages and classes can be specified for exclusion. This approach prevents the AppDynamics agent from tracking unnecessary or irrelevant methods, thus reducing overhead
and focusing on the most critical aspects of application performance.
References:
AppDynamics documentation on Call Graph Settings: This section details how to configure call graph settings, including the exclusion of specific classes and methods from instrumentation, to optimize performance monitoring.
Question 22:
Which type of Data Collector will capture code data such as method arguments, variables, and return values?
A. Method Invocation Data Collector
B. Servlet Container Collector
C. Transaction Data Collector
D. URI Data Collector
Correct Answer: A
The "Method Invocation Data Collector" is specifically designed to capture code-level data such as method arguments, variables, and return values. This type of data collector enables deep visibility into the execution of methods within
transactions, providing valuable insights into the application's behavior and performance. This detailed level of monitoring is essential for diagnosing complex issues and understanding the inner workings of business transactions.
References:
AppDynamics documentation on Data Collectors: Details the types of data collectors available, including Method Invocation Data Collectors, and how they can be used to capture detailed code-level data.
Question 23:
What are two options tor sharing snapshot details from the snapshot window? (Choose two.)
A. Custom Report
B. Custom Dashboard
C. Download PDF
D. Copy to Clipboard
E. Export
Correct Answer: CE
To share snapshot details from the snapshot window in AppDynamics, the options to "Download PDF" and "Export" are typically used. "Download PDF" allows users to generate a PDF report of the snapshot details, providing a convenient
and portable format for sharing and review. The "Export" option enables the extraction of snapshot data in various formats (e.g., CSV, XML), facilitating further analysis or sharing with other tools and stakeholders.
References:
AppDynamics documentation on Snapshots: This section covers how snapshots capture detailed performance data for transactions, including how to share and export this information for collaborative analysis.
Question 24:
Which two types of data are collected by Information Points? (Choose two.)
A. Troubleshooting Metric Data
B. Business Metric Data
C. Code Metric Data
D. Analytics Metric Data
Correct Answer: BC
Information Points in AppDynamics are designed to collect custom metrics that are specific to the business or code aspects of an application. They can capture Business Metric Data, which pertains to the performance metrics that directly
impact business processes, and Code Metric Data, which relates to the performance of specific methods or segments of code within the application. This allows for targeted monitoring and analysis of areas significant to the business's
objectives and technical performance.
References:
AppDynamics documentation on Information Points: Provides details on how to set up Information Points to collect custom business and code metrics for in-depth performance analysis.
Question 25:
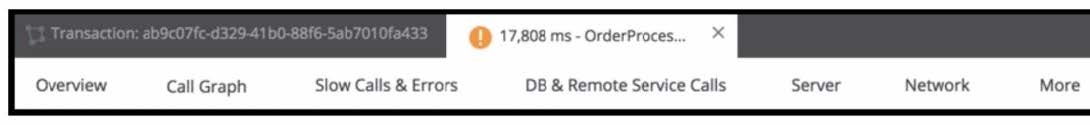
Refer to the exhibit.
On which tab will the configured transaction threshold be found?
A. Call Graph
B. Slow Calls and Error
C. DB and Remote Services Calls
D. Overview
E. More
Correct Answer: D
In Cisco AppDynamics, the transaction threshold configurations are typically found under the "Overview" tab. This is where you can view the health rule violations and performance baselines that are associated with transaction snapshots,
which can include the configured transaction thresholds. These thresholds set the acceptable performance limits for transactions, and when these limits are exceeded, it may trigger health rule violations that are visible on the Overview tab.
References:
AppDynamics Documentation on Transaction Snapshots AppDynamics Documentation on Health Rule Violations
Question 26:
Which permission allows snapshot archiving?
A. "Can view data from all applications"
B. "Configure Business Transactions"
C. "Agent Advanced Operation"
D. "Application level-Can create applications"
Correct Answer: C
The permission to enable snapshot archiving in AppDynamics typically falls under advanced operational capabilities, such as those categorized under "Agent Advanced Operation." This permission allows users to archive transaction
snapshots for long-term storage and analysis, which is essential for historical performance analysis and auditing purposes.
References:
AppDynamics documentation on Role-Based Access Control: Explains the different permissions and roles within AppDynamics, including those related to advanced agent operations and snapshot archiving.
Question 27:
A Performance Analyst has opened a database collector view. Which tab should be clicked on next to find slow queries?
A. Schemas
B. Queries
C. Live View
D. Object Browser
Correct Answer: B
When analyzing database performance in AppDynamics, the "Queries" tab within the database collector view is where a Performance Analyst should navigate to find slow queries. This tab presents a list of database queries executed by the
application, highlighting those with long execution times, which are potential bottlenecks impacting application performance.
References:
AppDynamics documentation on Database Monitoring: Details the database collector feature, including how to use the Queries tab to identify and analyze slow database queries.
Question 28:
A Business Transaction was registered and displayed on the Business Transaction Dashboard. It has continuous load on it. After an hour the Business Transaction stopped being displayed in the Business Transaction Dashboard. Which action stopped the display of the Business Transaction?
A. The Business Transaction Lock Down was enabled an hour ago.
B. The Business Transaction had been deleted an hour ago from the Business Transaction Dashboard.
C. The Business Transaction Custom Match Rule was deleted an hour ago.
D. The Business Transaction had been excluded an hour ago from the Business Transaction Dashboard.
Correct Answer: C
If a Business Transaction stops being displayed on the Business Transaction Dashboard after continuous load, it could be due to the deletion of the Business Transaction Custom Match Rule. Custom Match Rules in AppDynamics are used to
define custom business transactions based on specific criteria. If such a rule is deleted, transactions that were previously identified and displayed based on that rule may no longer be recognized as distinct business transactions, leading to
their disappearance from the dashboard.
References:
AppDynamics documentation on Business Transactions: Provides insights on configuring and managing business transactions, including the use of custom match rules.
Question 29:
When using the REST interlace where would a Performance Analyst go to see all of the capturedendpointsby service?
A. Navigate to the Metric Browser then to the specific metric. Copy the REST URL from the Metric Browser and then use a wildcard query to get the metrics for other SEPs.
B. Navigate to the Applications browser then drill down the requested endpoint with the available Dashboard and Metrics indicators then selected the desired metric.
C. Navigate to the Metric Browser then to the Consumed Endpoints location. Drill down in the metric browser on the specific endpoint to call out its services.
D. Access the MySQL database and find all the endpoints in an app. where can drill down to the tier and transactions using the endpoints. Select the appropriate REST feature enabled by the service endpoint.
Correct Answer: C
To view all captured endpoints by service using the REST interface in AppDynamics, a Performance Analyst would navigate to the Metric Browser and proceed to the "Consumed Endpoints" section. From there, drilling down on specific
endpoints within the Metric Browser allows the analyst to explore the services associated with each endpoint. This method enables detailed analysis of endpoint metrics, facilitating the monitoring and optimization of service performance.
References:
AppDynamics documentation on Metric Browser: Guides on navigating the Metric Browser to access and analyze various application metrics, including those related to endpoints and services.
AppDynamics documentation on REST API: Provides information on how to utilize the REST API for retrieving metrics, including endpoint data.
Question 30:
What are two differences between creating a Transaction Group using the 'Create Group' action and defining a Transaction Detection rule? (Choose two.)
A. A Transaction Detection Rule changes the name of the incoming request and reduces the number of overall Business transactions.
B. Create Transaction Group changes the name of the incoming request and reduces the number of overall Business transactions.
C. A Transaction Group aggregates the data of multiple transactions.
D. Transaction Groups create Transaction Detection Rules in a faster easier way.
Correct Answer: CD
Creating a Transaction Group using the 'Create Group' action in AppDynamics allows for the aggregation of data from multiple transactions under a single group, facilitating a consolidated view of similar transactions. This differs from defining
a Transaction Detection Rule, which typically focuses on identifying and categorizing individual transactions based on specific criteria. Transaction Groups do not change the names of incoming requests nor reduce the number of overall
business transactions; instead, they provide a method for organizing and analyzing related transactions collectively, offering a streamlined approach compared to individually configuring Transaction Detection Rules for each transaction.
References:
AppDynamics documentation on Business Transactions: Covers the concept of Transaction Groups and their role in organizing and analyzing transaction data, as well as the process for creating and managing Transaction Detection Rules.
Nowadays, the certification exams become more and more important and required by more and more enterprises when applying for a job. But how to prepare for the exam effectively? How to prepare for the exam in a short time with less efforts? How to get a ideal result and how to find the most reliable resources? Here on Vcedump.com, you will find all the answers. Vcedump.com provide not only Cisco exam questions, answers and explanations but also complete assistance on your exam preparation and certification application. If you are confused on your 500-420 exam preparations and Cisco certification application, do not hesitate to visit our Vcedump.com to find your solutions here.