Exam Details
Exam Code
:CLSSBBExam Name
:Certified Lean Six Sigma Black Belt (LSSBB)Certification
:Six Sigma CertificationsVendor
:Six SigmaTotal Questions
:639 Q&AsLast Updated
:Apr 10, 2025
Six Sigma Six Sigma Certifications CLSSBB Questions & Answers
-
Question 91:
Time is always the metric on the horizontal scale of a(n) ___________ Chart.
A. Pareto
B. Xbar
C. Multi-Vari
D. NP
-
Question 92:
To properly analyze the variables impacting the output of a process we need to collect data that represents at least 80% of the variation in the process and assure ourselves we are collecting data from all three types of variation which are _______________.
A. Within, Between and Temporal
B. Within, Between and Temporary
C. Without, Above and Below
D. Induced, Natural and Unavoidable
-
Question 93:
To be an effective Lean Six Sigma practitioner one must understand the difference between ___________________________.
A. ANOVA and the Analysis of Variance
B. Nonparametric tests and tests of Non-normal Data
C. F-test and test of variances of 2 samples
D. Practical and Statistical significance
-
Question 94:
A Belt is analyzing data and upon creation of the graphical analysis sees multiple modes. One of the primary reasons this could occur is because the process has experienced a ____________________.
A. Significant change from one shift to another
B. Sizable Measurement System error
C. Catastrophic failure of some sort
D. Any one of these
-
Question 95:
From the variance F-test shown above, which of these conclusions is/are valid?

A. The variance between the class score distribution is significantly different
B. The variance between the class score distribution is not significantly different
C. This test applies only to Normal Distributed data at 99 % confidence
D. This test applies only to Non-normal Data at 99 % confidence
E. There are not enough data points to make any statistical conclusions
-
Question 96:
When conducting a Hypothesis Test using Continuous Data the proper sample size is influenced by the extent to which we need to assess a Difference to be detected and the inherent variation in the process.
A. True
B. False
-
Question 97:
The validity of the decision made with Hypothesis Testing is dependent upon all of these except __________________.
A. Beta risk
B. Alpha risk
C. Range of data
D. Sample size
-
Question 98:
Statistical Difference is the magnitude of difference or change required to distinguish between a true difference, brought about by change or improvement, and one that could have occurred by chance.
A. True
B. False
-
Question 99:
For the data set shown here which of these statements is/are true?
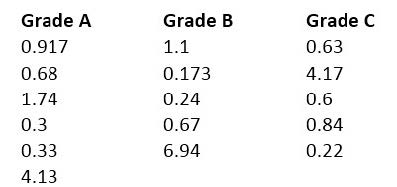
A. Hypothesis Testing of Means or Medians cannot be done since there are an unequal number of observations for the 3 samples
B. A Paired T-test would be applicable for comparing Grade B and Grade A since they follow each other in the data set
C. Grade A has the lowest sample Mean of the 3 samples
D. Grade A has a higher sample Mean than Grade B
-
Question 100:
Review the analysis shown there.
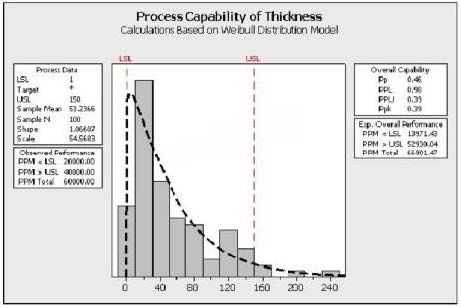
Which statements are true about the process? (Note: There are 3 correct answers).
A. The initial focus for this project would be to determine why the thicknesses are so frequently too low.
B. The majority of the process is closer to the lower specification limit.
C. This process is described with the Weibull Distribution.
D. The process has more problems with Variation than Centering.
E. The process follows a non-normal distribution with the given data.
Related Exams:
Tips on How to Prepare for the Exams
Nowadays, the certification exams become more and more important and required by more and more enterprises when applying for a job. But how to prepare for the exam effectively? How to prepare for the exam in a short time with less efforts? How to get a ideal result and how to find the most reliable resources? Here on Vcedump.com, you will find all the answers. Vcedump.com provide not only Six Sigma exam questions, answers and explanations but also complete assistance on your exam preparation and certification application. If you are confused on your CLSSBB exam preparations and Six Sigma certification application, do not hesitate to visit our Vcedump.com to find your solutions here.