Exam Details
Exam Code
:CLSSBBExam Name
:Certified Lean Six Sigma Black Belt (LSSBB)Certification
:Six Sigma CertificationsVendor
:Six SigmaTotal Questions
:639 Q&AsLast Updated
:Apr 10, 2025
Six Sigma Six Sigma Certifications CLSSBB Questions & Answers
-
Question 121:
Which statement is NOT correct about the Fitted Line Plot shown here?
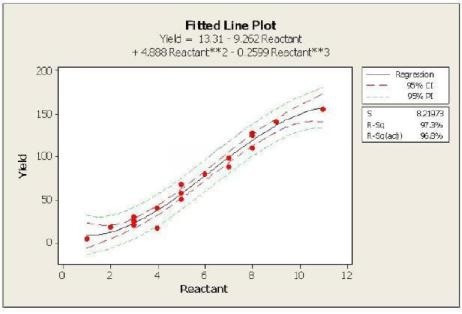
A. The independent variable is the reactant
B. If the reactant was 6 units, with 95 % confidence we would expect a minimum yield of 100 units
C. With at least 95% confidence, we can expect less than 10 units of Yield when the reactant is at a value of 1
D. A reactant value between 2 and 4 units yields around 20 to 40
E. When the reactant increases, the expected yield would increase
-
Question 122:
Which statement(s) are incorrect for the Regression Analysis shown here? (Note: There are 2 correct answers).
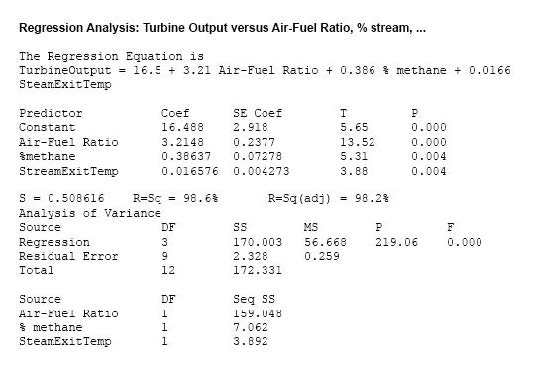
A. The air-fuel ratio explains most of the TurbineOutput variation
B. The Regression explains over 98% of the process variation
C. This Multiple Linear Regression has three statistically significant independent variables
D. If the air-fuel ratio increases by 1, the TurbineOutput more than triples
E. The SteamExitTemp explains the most variation of the TurbineOutput
-
Question 123:
Which statement(s) are most correct for the Regression Analysis shown here?
A. The Regression explains 50.8% of the process variation
B. The air-fuel ratio explains most of the TurbineOutput variation
C. This Simple Linear Regression explains 98+% of the process variation
D. This Multiple Linear Regression has four statistically significant independent variables
-
Question 124:
It would be more likely than not for a Belt conducting a Regression Analysis to find that the _______________________.
A. r2 value is smaller than the absolute value of r
B. Correlation Coefficient equals r2
C. Coefficient of Determination is less than r2
D. Correlation Coefficient equals r divided by 2
-
Question 125:
When a Belt properly analyzes the results of an experiment he must examine the Residuals in expectation of finding all of the following except _________.
A. Some Residuals higher than others
B. Some Residuals lower than others
C. All Residuals within 2 Standard Deviations of the Mean
D. Residuals will represent a Linear Regression
-
Question 126:
When doing Hypothesis Testing on Non-normal data Belts will use a ________________ to compare more than two sample proportions to each other.
A. Z score Table
B. Sakami Table
C. Mean-to-Mode Analysis
D. Contingency Table
-
Question 127:
When a Belt conducts a Linear Correlation Analysis and finds that as an X increases the Y also increase then he has proven a ______________ correlation.
A. Negative
B. Positive
C. Monomial
D. Single alignment
-
Question 128:
A valid Multiple Linear Regression (MLR) is characterized by all of these except _______________________.
A. It is an assumption that the X's (inputs) are not correlated to each other
B. The X's (inputs) are assumed to be independent of each other
C. MLR is conducted based on a deliberate form of experimentation
D. The Residuals from MLR analysis have to be Normally Distributed
-
Question 129:
A valid mathematical Regression represents all of the characteristics shown except ___________________________.
A. The residuals when plotted follow a Normal Distribution
B. The sum of the residuals is zero
C. All of the standardized residuals will be within ? Standard Deviations
D. Most standardized residuals are within ? Standard Deviations
-
Question 130:
Screening experiments are the proper choice when a Belt is faced with the situation of highly Fractional Factorial Designs.
A. True
B. False
Related Exams:
Tips on How to Prepare for the Exams
Nowadays, the certification exams become more and more important and required by more and more enterprises when applying for a job. But how to prepare for the exam effectively? How to prepare for the exam in a short time with less efforts? How to get a ideal result and how to find the most reliable resources? Here on Vcedump.com, you will find all the answers. Vcedump.com provide not only Six Sigma exam questions, answers and explanations but also complete assistance on your exam preparation and certification application. If you are confused on your CLSSBB exam preparations and Six Sigma certification application, do not hesitate to visit our Vcedump.com to find your solutions here.