Exam Details
Exam Code
:CLSSBBExam Name
:Certified Lean Six Sigma Black Belt (LSSBB)Certification
:Six Sigma CertificationsVendor
:Six SigmaTotal Questions
:639 Q&AsLast Updated
:Apr 10, 2025
Six Sigma Six Sigma Certifications CLSSBB Questions & Answers
-
Question 281:
Fractional Factorial Designs are used to analyze factors to model the output as a function of inputs if Hypothesis Testing in the Analyze Phase was inadequate to sufficiently narrow the factors that significantly impact the output(s).
A. True
B. False
-
Question 282:
Fractional Factorial designs are used to reduce the time and cost of experiments because the ____________ has been lowered.
A. Number of data measurement points
B. Number of runs
C. People involved
D. Output summary
-
Question 283:
Which statement(s) are incorrect for the Regression Analysis shown here? (Note: There are 2 correct answers).
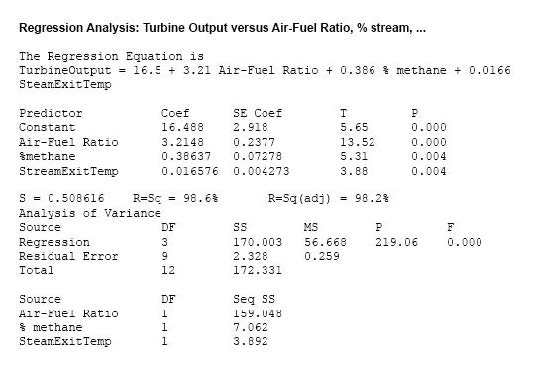
A. The air-fuel ratio explains most of the TurbineOutput variation
B. The Regression explains over 98% of the process variation
C. This Multiple Linear Regression has three statistically significant independent variables
D. If the air-fuel ratio increases by 1, the TurbineOutput more than triples
E. The SteamExitTemp explains the most variation of the TurbineOutput
-
Question 284:
Which statement(s) are correct about the Factorial Plot shown here? (Note: There are 3 correct answers).
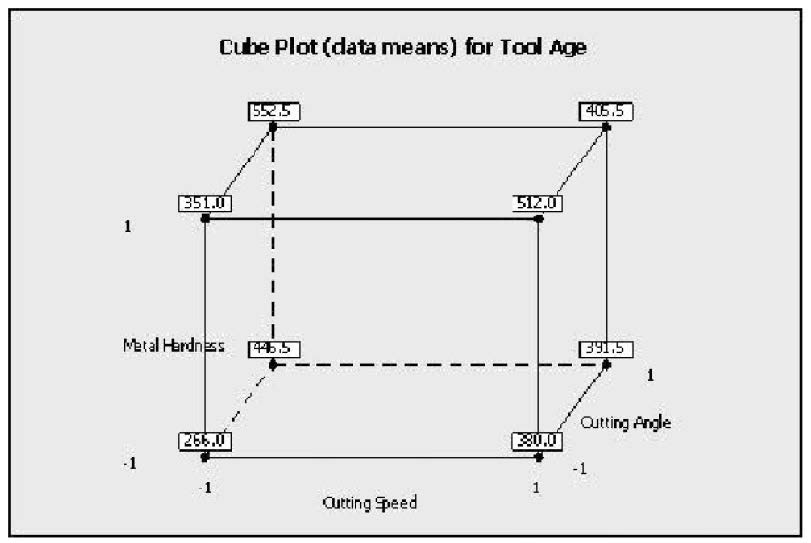
A. When the cutting speed increased from low to high level, the tool age increases
B. The coefficient of the metal hardness is positively related to the output of tool age
C. The coded coefficient is lower for cutting speed than the cutting angle related to the output of tool age
D. These plots prove a statistically significance factor with 95% confidence
E. These plots are an example of interaction plots
-
Question 285:
A Full Factorial experiment using a 2 level 4 factor approach has been proposed to test the viability of an extrusion machine experiment. How many treatment combinations will this approach involve?
A. 8
B. 16
C. 32
D. 64
-
Question 286:
Using this partial Z Table, how many units from a month's production run are expected to not satisfy customer requirements for the following process? Upper specification limit: 8.4 Lower specification limit: 4.7 Mean of the process: 6.2 Standard Deviation: 2.2 Monthly production: 360 units
A. 8
B. 13
C. 28
D. 57
-
Question 287:
If a Belt needed to model the data for the number of weaves in section of carpet fabric she would use the _____________ Distribution approach.
A. Poisson
B. Extended
C. Exponential
D. Weibull
-
Question 288:
When analyzing the behavior of our process to assess customer satisfaction we are concerned about both the variation such that it stays within the spec limits and how well the Mean is __________________ the process requirements.
A. Balanced against
B. Over and above
C. Twice as great as
D. Centered relative to
-
Question 289:
The _______ is the most frequently occurring value in a distribution of data.
A. Median
B. Mean
C. Center Point
D. Mode
-
Question 290:
Use this data to calculate the Z Score. Average of: 92, Standard Deviation: 2, Upper Spec Limit: 101
A. 0.75
B. 1.5
C. 2.25
D. 4.50
Related Exams:
Tips on How to Prepare for the Exams
Nowadays, the certification exams become more and more important and required by more and more enterprises when applying for a job. But how to prepare for the exam effectively? How to prepare for the exam in a short time with less efforts? How to get a ideal result and how to find the most reliable resources? Here on Vcedump.com, you will find all the answers. Vcedump.com provide not only Six Sigma exam questions, answers and explanations but also complete assistance on your exam preparation and certification application. If you are confused on your CLSSBB exam preparations and Six Sigma certification application, do not hesitate to visit our Vcedump.com to find your solutions here.