Exam Details
Exam Code
:CLSSBBExam Name
:Certified Lean Six Sigma Black Belt (LSSBB)Certification
:Six Sigma CertificationsVendor
:Six SigmaTotal Questions
:639 Q&AsLast Updated
:Apr 18, 2025
Six Sigma Six Sigma Certifications CLSSBB Questions & Answers
-
Question 451:
An experiment has seven factors with two levels each. The experiment has eight runs. This experimental design is called:
A. full factorial design
B. half fractional factorial design
C. interaction
D. none of the above
-
Question 452:
(Refer to the previous problem) To estimate the within treatment variance the experimenters would calculate the variances of:
A. all 80 readings
B. the five replications for each run
C. the runs for which a factor is at its lowest level
-
Question 453:
(Refer to the previous problem) The variance of the five replications for each run is calculated. Most of these variances are approximately equal but two are significantly lower than the others. The experimenters would be especially interested in those two runs if they want to optimize:
A. dissolution time
B. interactions
C. main effects
D. robustness
E. degrees of freedom
-
Question 454:
A pharmaceutical manufacturer is designing an experiment to test four different capsule ingredients designed to reduce dissolution time. Each ingredient will be tested at 10 milligrams and 40 milligrams. A full factorial design is used with five replications per run. The number of levels, factors and runs is, respectively:
A. 2, 4, 16
B. 4, 5, 8
C. 10, 4, 40
D. 2, 20, 16
-
Question 455:
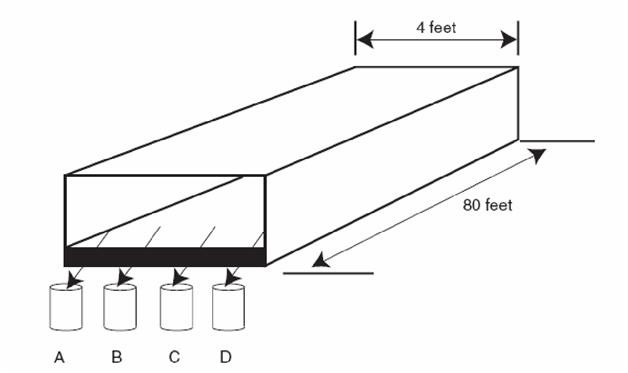
SCENARIO A Six Sigma team is measuring the moisture content of corn starch as it leaves the conveyer belt of a dryer. They collect one sample four cups of starch at times indicated in the chart at fixed locations labeled A, B, C, and D across the end of the belt. See the diagram below.
Find the sample linear correlation coefficient and the sample coefficient of determination for the data in problem VI.11.
A. 0.83, 0.69
B. 0.49, 0.24
C. 0.74, 0.55
D. 0.33, 0.11
-
Question 456:
SCENARIO A Six Sigma team is measuring the moisture content of corn starch as it leaves the conveyer belt of a dryer. They collect one sample four cups of starch at times indicated in the chart at fixed locations labeled A, B, C, and D across the end of the belt. See the diagram below.

Find the equation of the regression line for these sample data points: (1, 7) (3, 3) ( 3, 2) (5, ?)
A. y = 10.8 ?2.9x
B. y = 12.9 + 5.2x
C. y = 16 ?3.7x
D. y = 8.75 ?2x
E. y = 22.6 ?4.8x
-
Question 457:
SCENARIO A Six Sigma team is measuring the moisture content of corn starch as it leaves the conveyer belt of a dryer. They collect one sample four cups of starch at times indicated in the chart at fixed locations labeled A, B, C, and D across the end of the belt. See the diagram below.
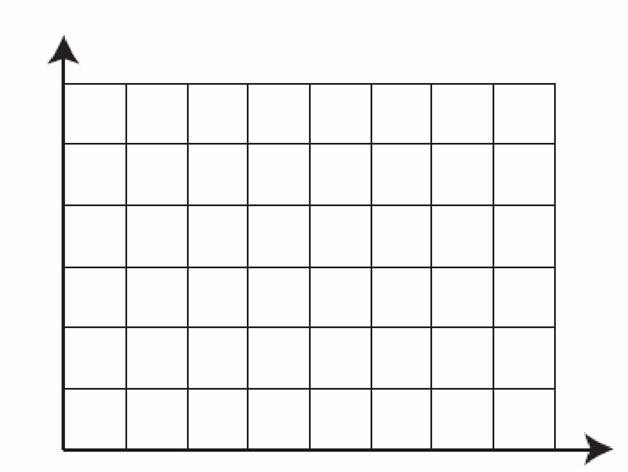
After some more work on the dryer, additional data are collected which when plotted looks like this:
Which type of variation dominates?
A. within sample
B. sample to sample within the hour
C. hour to hour
D. none of the above
-
Question 458:
SCENARIO A Six Sigma team is measuring the moisture content of corn starch as it leaves the conveyer belt of a dryer. They collect one sample four cups of starch at times indicated in the chart at fixed locations labeled A, B, C, and D across the end of the belt. See the diagram below.
After some work on the dryer, additional data are collected which when plotted looks like this: Which type of variation dominates?
A. within sample
B. sample to sample within the hour
C. hour to hour
D. none of the above
-
Question 459:
SCENARIO A Six Sigma team is measuring the moisture content of corn starch as it leaves the conveyer belt of a dryer. They collect one sample four cups of starch at times indicated in the chart at fixed locations labeled A, B, C, and D across the end of the belt. See the diagram below.
The data for a nine hour period are:
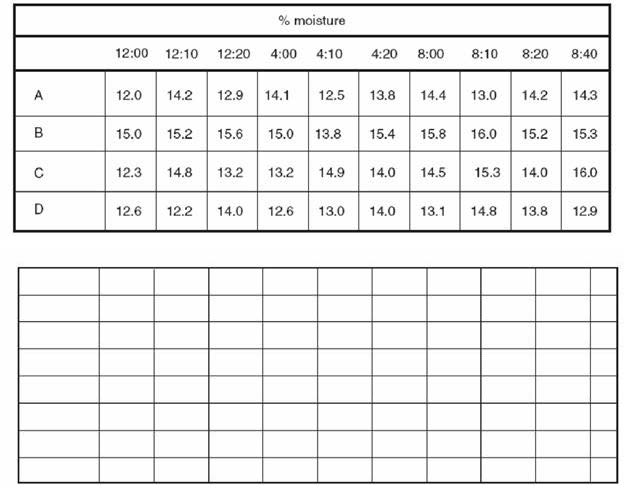
Which type of variation dominates? (Hint: Plot the points on the graph above.)
A. within sample
B. sample to sample within the hour
C. hour to hour
D. none of the above
-
Question 460:
The Toronto plant produces appliances in the following distribution: Type A 23% Type B 42% Type C 35% A random sample of 300 appliances from the Texas plant has the following distribution: Type A 73 Type B 111 Type C 116 Is the distribution of appliances at the Texas plant the same as that at the Toronto plant?
A. yes
B. no
Related Exams:
Tips on How to Prepare for the Exams
Nowadays, the certification exams become more and more important and required by more and more enterprises when applying for a job. But how to prepare for the exam effectively? How to prepare for the exam in a short time with less efforts? How to get a ideal result and how to find the most reliable resources? Here on Vcedump.com, you will find all the answers. Vcedump.com provide not only Six Sigma exam questions, answers and explanations but also complete assistance on your exam preparation and certification application. If you are confused on your CLSSBB exam preparations and Six Sigma certification application, do not hesitate to visit our Vcedump.com to find your solutions here.