Exam Details
Exam Code
:C2090-621Exam Name
:IBM Cognos Analytics Author V11Certification
:IBM CertificationsVendor
:IBMTotal Questions
:104 Q&AsLast Updated
:Apr 15, 2025
IBM IBM Certifications C2090-621 Questions & Answers
-
Question 11:
A report author is building a report intended for an iPad on the Cognos Mobile App. The report consists of two Charts that need to be side by side when the tablet is landscape and on top of each other when the tablet is portrait.
What technique should be used to accomplish this?
A. Make the size of both Charts a percentage of the page width.
B. Contain the Charts in two cells of the same table, with a fixed size.
C. Contain both charts in separate blocks, with fixed widths and box type set as inline
D. Use a conditional style on one of the Charts to adjust its position based on the orientation of the iPad.
-
Question 12:
A report author wants to filter a report on two data items, and has decided to use a combined filter rather than two custom filters.
Why has the report author decided to use a combined filter?
A. A report author should always use advanced filters instead of combined filters.
B. Using two custom filters and one combined filter is exactly the same and either one can be used.
C. A combined filter would allow to combine the values of two data items and then filter on the combined values.
D. A combined filter will allow the use of two custom filters joined by either `AND', `OR', or `NOT' operators in between.
-
Question 13:
The user of a Dashboard needs a visualization using three categories and one value.
Which visualization should be used?
A. Grid
B. Heat
C. Point
D. Tree map
-
Question 14:
A report author needs to create an Active Report and consider how connections, variables and interactive behaviors using data controls will be handled in the template.
How will these be handled?
A. Connections cannot be removed from templates.
B. Only connections can be removed or added from templates.
C. Connections, variables and interactive using data controls will be removed from the template.
D. Connections, variables and interactive using data controls cannot be removed from the template.
-
Question 15:
A customer wants to report the product types with the largest average revenue. In addition, the total revenue should be shown and all product types with revenue less than three percent (>3%) in a single bar.
Targeting this result: How can this be done?
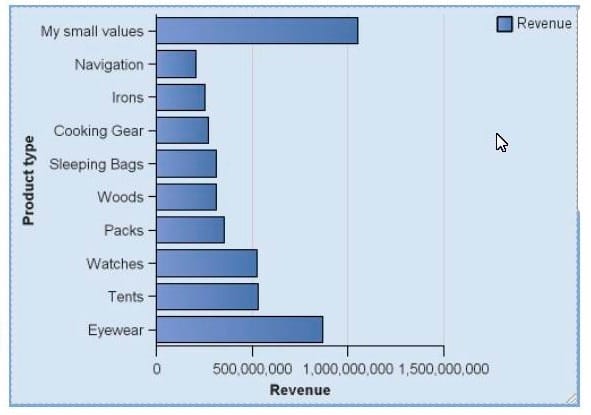
A. Using a visualization, because it is not possible in the default chart engine.
B. Using the property "summarize small items" on the chart, the type total and setting the item label. Set the order on the default measure.
C. Using the property "summarize small items" on the chart, the type average and setting the item label. Set the order on the chart node member.
D. Writing a new query where you summarize the Product types and create a new "My small value" item based on the calculated average. Order the values in the query.
-
Question 16:
A report author is building an Active Report for mobile use on an iPad. The report contains a list object. The report author wants to ensure the entire list has a consistent size so that it does not affect the report layout.
Which techniques should be used to ensure this? (Choose two.)
A. Specify the exact width for all columns in the list.
B. Specify the exact width for only the measure columns in the list.
C. Surround the list in a defined size block with "Content is not clipped".
D. Limit the number of rows returned with the use of a style variable on the list.
E. Surround the list in a defined size block with the "Use scrollbars only when necessary" property chosen.
-
Question 17:
A report author is asked to create a list report with alternating colored rows as shown here: How can this be done?
A. By applying a Theme.
B. By using the toolbox item Alternating list.
C. By setting the property in the COLOR and BACKGROUND section of the list.
D. By using an expression to control the conditional formatting of alternating rows.
-
Question 18:
A report author wants to generate an Active Report with a Chart, and allow the user to highlight a column within the Chart when a radio button is selected.
How should the report be created?
A. Using a Data deck.
B. Apply a client side filter.
C. Setting the Dynamic Chart property.
D. Setting the local processing property.
-
Question 19:
A report author needs the label in a List column title to be dynamic.
How can this be implemented with a dynamic value?
A. Pivot the List to a Crosstab.
B. Create a Master detail relationship to the data.
C. Unlock the report and insert a data item into the List column title.
D. Select the List column title and change the Source type to Data item label.
-
Question 20:
Which properties must be set when using a SQL object?
A. Data source and SQL
B. Package name and SQL
C. Cardinality and namespace
D. Primary Key and namespace
Related Exams:
C1000-002
IBM MQ V9.0 System AdministrationC1000-003
IBM Mobile Foundation v8.0 Application DevelopmentC1000-004
IBM Curam SPM V7.X Application DeveloperC1000-007
IBM Cloud Application Development v3C1000-010
IBM Operational Decision Manager Standard V8.9.1 Application DevelopmentC1000-012
IBM Watson Application Developer V3.1C1000-015
IBM Business Process Manager V8.6 Application Development using Process DesignerC1000-018
IBM QRadar SIEM V7.3.2 Fundamental AnalysisC1000-020
IBM New Workloads Sales V2C1000-021
IBM Virtualized Storage V2
Tips on How to Prepare for the Exams
Nowadays, the certification exams become more and more important and required by more and more enterprises when applying for a job. But how to prepare for the exam effectively? How to prepare for the exam in a short time with less efforts? How to get a ideal result and how to find the most reliable resources? Here on Vcedump.com, you will find all the answers. Vcedump.com provide not only IBM exam questions, answers and explanations but also complete assistance on your exam preparation and certification application. If you are confused on your C2090-621 exam preparations and IBM certification application, do not hesitate to visit our Vcedump.com to find your solutions here.