Exam Details
Exam Code
:C2090-621Exam Name
:IBM Cognos Analytics Author V11Certification
:IBM CertificationsVendor
:IBMTotal Questions
:104 Q&AsLast Updated
:Apr 15, 2025
IBM IBM Certifications C2090-621 Questions & Answers
-
Question 21:
What must be done to use personal data on a report?
A. Create a Data module.
B. Import the data into a package.
C. Include the uploaded file as a Data source.
D. Modify the package capability to allow for text processing.
-
Question 22:
A report author is asked to create a page break on a List.
What are the initial steps to be taken?
A. Click on Navigate> Click Report Pages> Add Page set> Associate the data item to the page.
B. Select report> Click on properties> Select Report tab> Report options> Add page break> Associate the data item to the page.
C. In the properties pane, under Data click Pages set> From the data items pane, drag the data item page break is based on.
D. Click on Navigate> Click Report Pages> From Toolbox, and Page set to the Report pages pane> In properties pane, under DATA point the preferred query to the query list.
-
Question 23:
Which option is true when a report author is designing report for mobile users?
A. Use fixed size objects.
B. Set all objects to Portrait view.
C. Set margins between objects in the report.
D. Size the objects as a percentage of the available.
-
Question 24:
What is the maximum number of objects within an Active Report designed for mobile use?
A. 10
B. 256
C. 4096
D. unlimited
-
Question 25:
A company distributes a monthly email to the sales managers at the beginning of each month that shows how well they are doing using a tabular formatted report. The report is delivered in Excel format and the sales managers would like the report to be in a Crosstab format.
How should the report be changed?
A. Use the convert list to Crosstab option. Format and sort the Crosstab appropriately. Save the report.
B. Add a Crosstab data container to the report. Format and sort it appropriately. Delete the list data container and save the report.
C. Use the convert list to Crosstab option. Format and soft the Crosstab appropriately. Add a page set that is grouped on sales manager.
D. Add a repeater to the report. Use the convert list to Crosstab option. Format and sort the Crosstab appropriately. Place the Crosstab within the repeater. create a Master detail relationship between the Crosstab and the repeater on sales manager. Save the report.
-
Question 26:
A report author requires two conditional styles to be both of which are used on a column.
How can the order in which to evaluate the conditions be specified?
A. Go to the "Manage Conditional Styles@ menu and click the move up or more down arrow.
B. The order cannot be defined. All conditions are evaluated and combined in an "AND" logic.
C. By clicking a condition on a selected column and then clicking the move up or move down arrow.
D. The order in which the conditions are evaluated depends on the order of the underlying query item inside the query.
-
Question 27:
A report author wants to provide a filter in a report on a data item that has a very large number of distinct values and the users may not know the complete names of the district values.
What type of prompt should be used?
A. Value prompt
B. Text box prompt
C. Generated prompt
D. Select and search prompt
-
Question 28:
The sales department has requested a change to a tabular account report and wants to be able to analyze the monthly amount of each Account name by Year. The report author changed the original report on left to the report on the right.
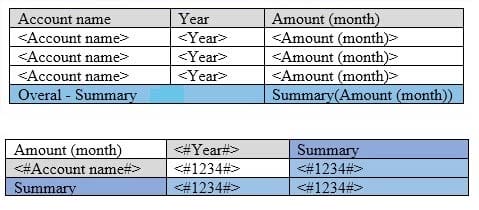
How was this done?
A. Select Year column and then use the toolbar button Convert to Crosstab.
B. Select Year column and then use the toolbar button Pivot List Crosstab.
C. Select Amount(month) column and then use the toolbar button Convert to Crosstab.
D. Select Account name column and then use the toolbar button Pivot List To Crosstab.
-
Question 29:
A customer has a bar chart in a report that displays a steady increase in revenue by product line over time. The requirement is to graphically illustrate this progression in the data series without significantly the report.
How can this be done?
A. Add a linear trendline to the chart.
B. Add a polynomial trendline to the chart.
C. Create and insert graphics to highlight the data points.
D. Hide data values within the chart and make the bars larger.
-
Question 30:
A report author renders an Active Report as an TML file on the local computer.
Where are the Charts Created?
A. All Charts are rendered in the client.
B. All Charts are rendered on the server.
C. Non-prompted Charts are rendered in the client.
D. Only prompted Charts are rendered on the server.
Related Exams:
C1000-002
IBM MQ V9.0 System AdministrationC1000-003
IBM Mobile Foundation v8.0 Application DevelopmentC1000-004
IBM Curam SPM V7.X Application DeveloperC1000-007
IBM Cloud Application Development v3C1000-010
IBM Operational Decision Manager Standard V8.9.1 Application DevelopmentC1000-012
IBM Watson Application Developer V3.1C1000-015
IBM Business Process Manager V8.6 Application Development using Process DesignerC1000-018
IBM QRadar SIEM V7.3.2 Fundamental AnalysisC1000-020
IBM New Workloads Sales V2C1000-021
IBM Virtualized Storage V2
Tips on How to Prepare for the Exams
Nowadays, the certification exams become more and more important and required by more and more enterprises when applying for a job. But how to prepare for the exam effectively? How to prepare for the exam in a short time with less efforts? How to get a ideal result and how to find the most reliable resources? Here on Vcedump.com, you will find all the answers. Vcedump.com provide not only IBM exam questions, answers and explanations but also complete assistance on your exam preparation and certification application. If you are confused on your C2090-621 exam preparations and IBM certification application, do not hesitate to visit our Vcedump.com to find your solutions here.