Exam Details
Exam Code
:PL-300Exam Name
:Microsoft Power BI Data AnalystCertification
:Microsoft CertificationsVendor
:MicrosoftTotal Questions
:400 Q&AsLast Updated
:Mar 28, 2025
Microsoft Microsoft Certifications PL-300 Questions & Answers
-
Question 211:
DRAG DROP
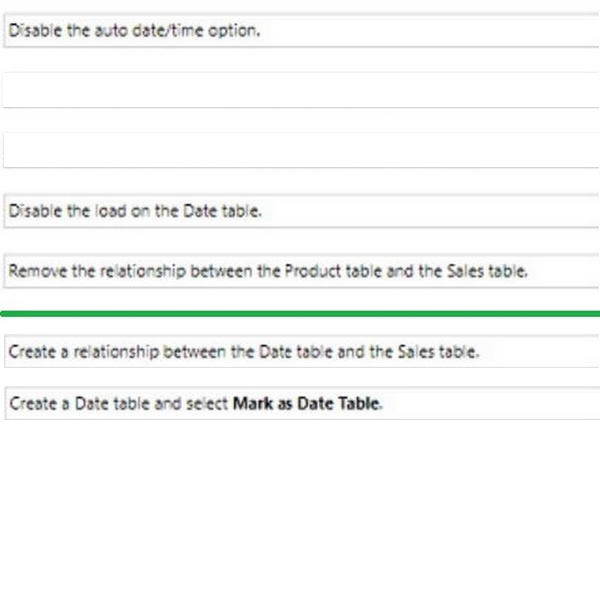
You have a Power BI data model that analyzes product sales ever time. The data model contains the following tables.
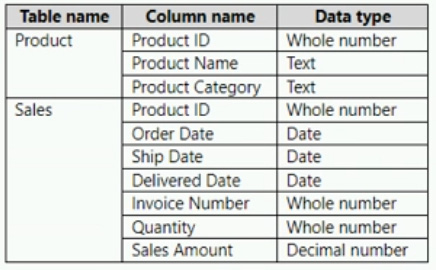
A one-to-many relationship exists between the tables.
The auto date/time option for the data model is enabled.
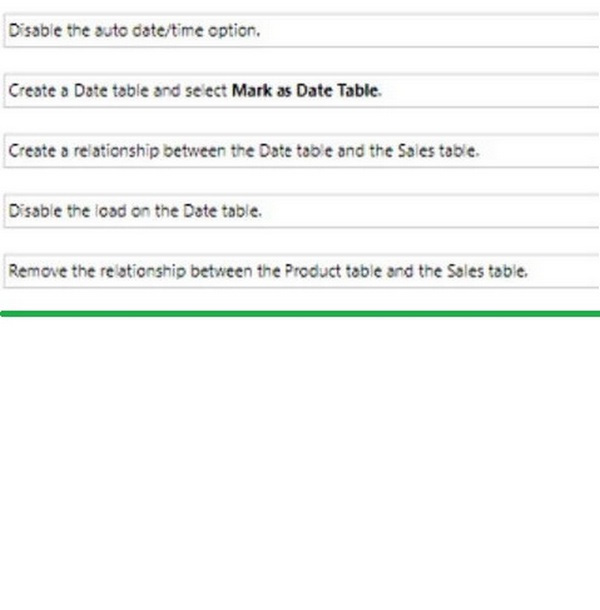
You need to reduce the size of the data model while maintaining the ability to analyze product sales by month and quarter.
Which two actions should you perform? Each correct answer presents part of the solution.
NOTE: Each correct answer is worth one point.
Select and Place:
-
Question 212:
DRAG DROP
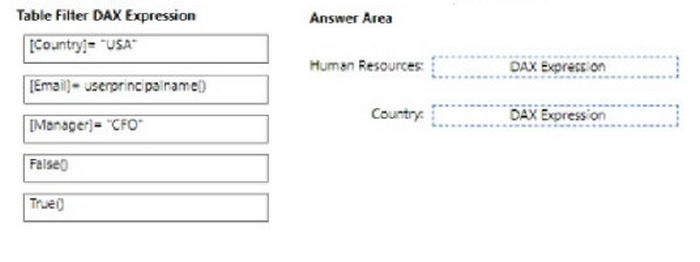
You have the Power BI data model shown in the following exhibit.
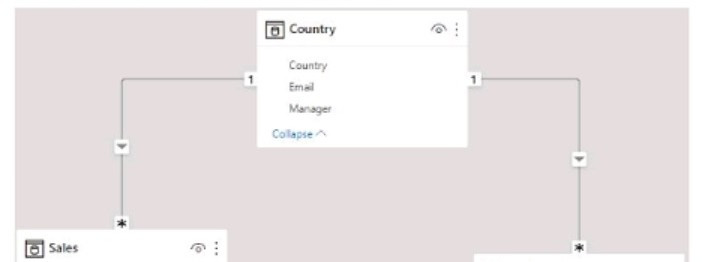
Select and Place:
-
Question 213:
DRAG DROP
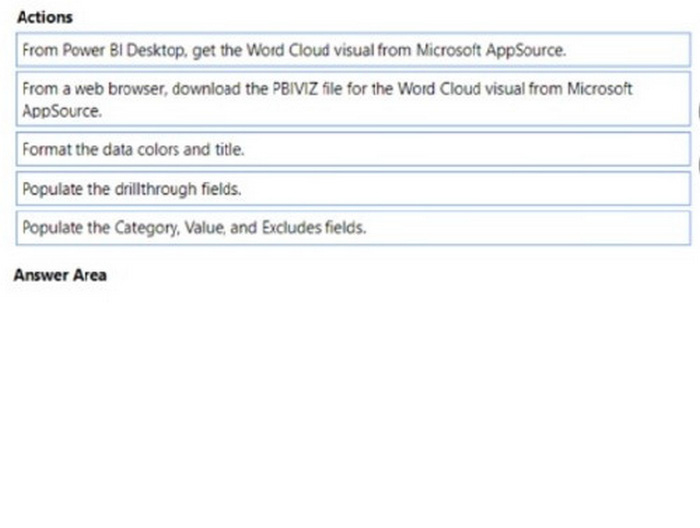
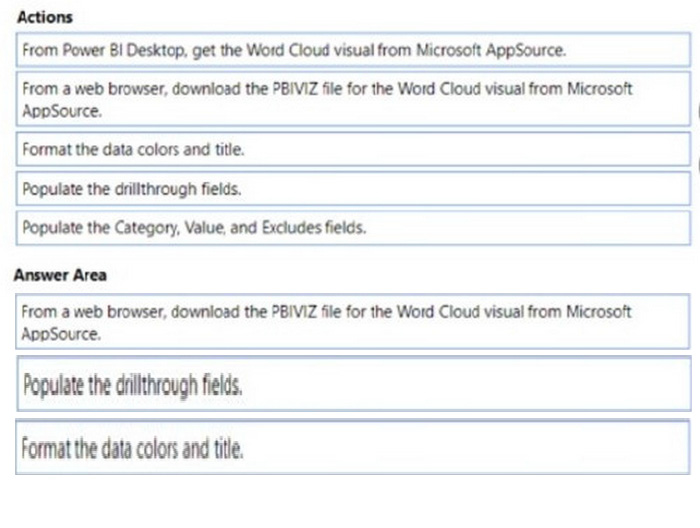
You use Power Bi Desktop to create a Power Bl data model and a blank report You need to add the Word Cloud visual shown in the following exhibit to the report.

The solution must minimize development effort
Which three actions should you perform in sequence? To answer, move the appropriate actions from the list of actions to the answer area and arrange them in the correct order.
Select and Place:
-
Question 214:
DRAG DROP
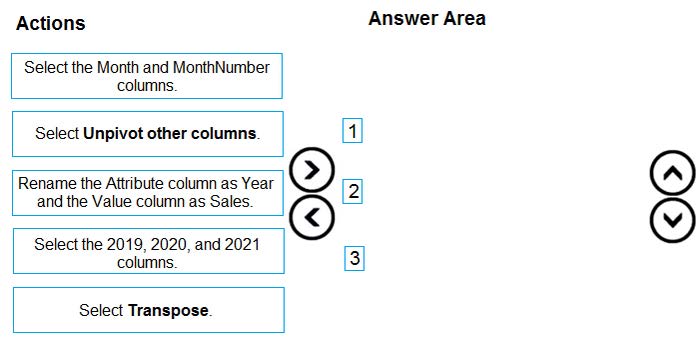
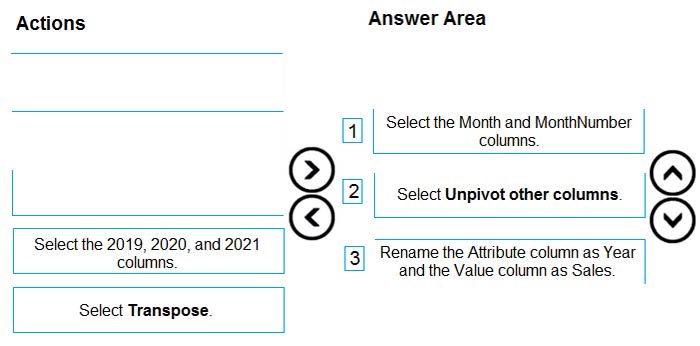
You receive annual sales data that must be included in Power BI reports.
From Power Query Editor, you connect to the Microsoft Excel source shown in the following exhibit.
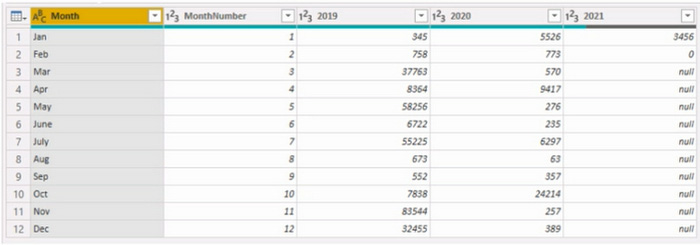
You need to create a report that meets the requirements:
1.
Visualizes the Sales value over a period of years and months
2.
Adds a Slicer for the month
3.
Adds a Slicer for the year
Which three actions should you perform in sequence? To answer, move the appropriate actions from the list of actions to the answer area and arrange them in the correct order.
Select and Place:
-
Question 215:
DRAG DROP
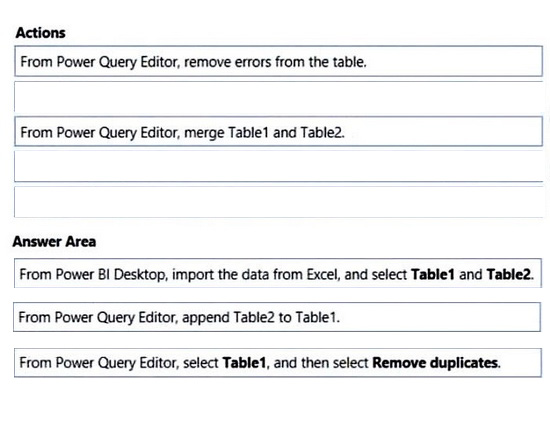
You have a Microsoft Excel workbook that contains two sheets named Sheet1 and Sheet2. Sheet1 contains the following table named Table1.
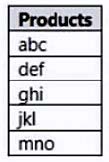
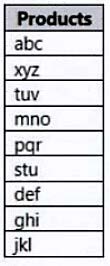
Sheet2 contains the following table named Table2.
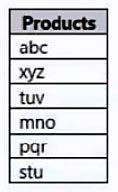
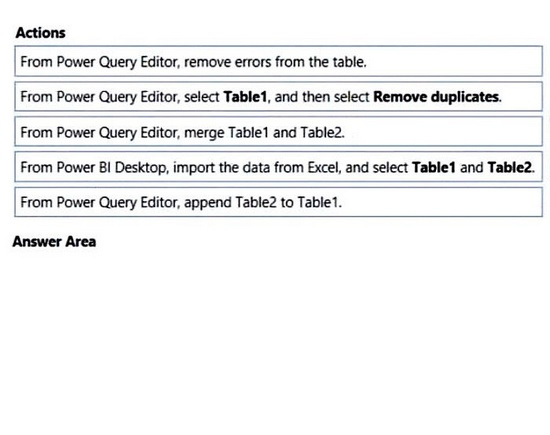
You need to use Power Query Editor to combine the products from Table1 and Table2 into the following table that has one column containing no duplicate values.
Which three actions should you perform in sequence? To answer, move the appropriate actions from the list of actions to the answer area and arrange them in the correct order.
Select and Place:
-
Question 216:
DRAG DROP
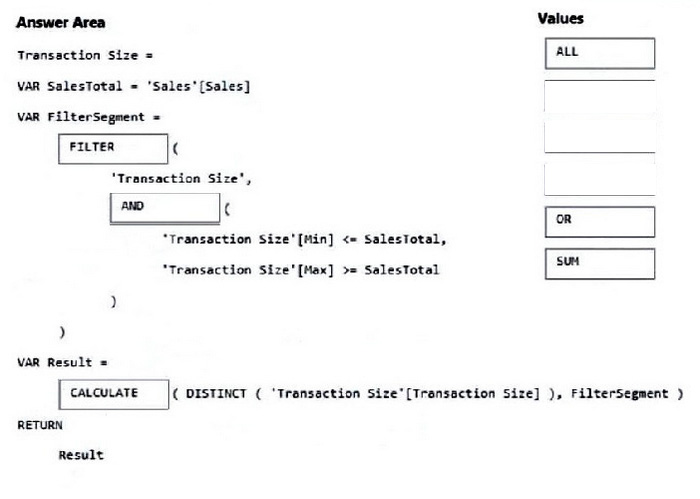
You are modifying a Power Bi model by using Power Bl Desktop.
You have a table named Sales that contains the following fields.
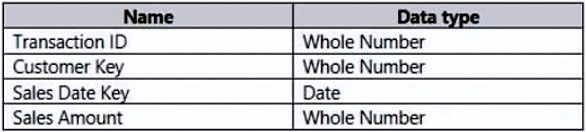
You have a table named Transaction Size that contains the following data.
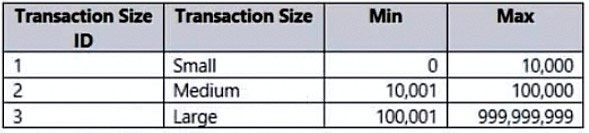
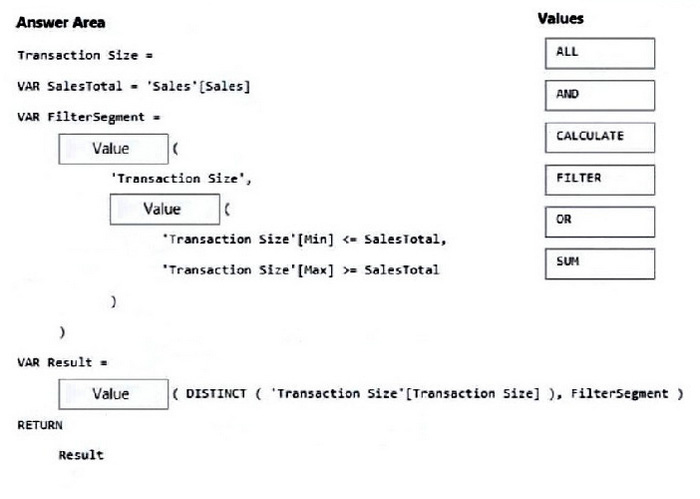
You need to create a calculated column to classify each transaction as small, medium, or large based on the value in Sales Amount.
How should you complete the code? To answer, drag the appropriate values to the correct targets. Each value may be used once, more than once, or not at all.
You may need to drag the split bar between panes or scroll to view content.
NOTE: Each correct selection is worth one point.
Select and Place:
-
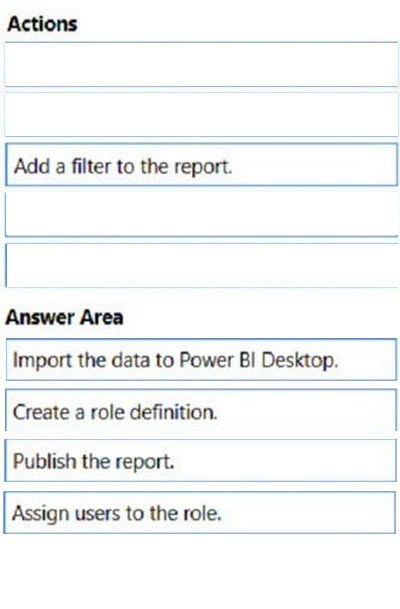
Question 217:
DRAG DROP
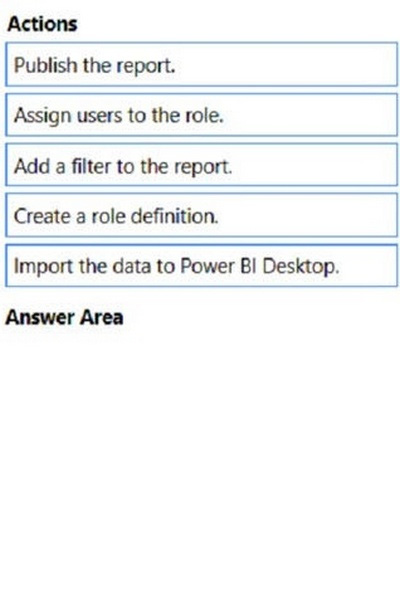
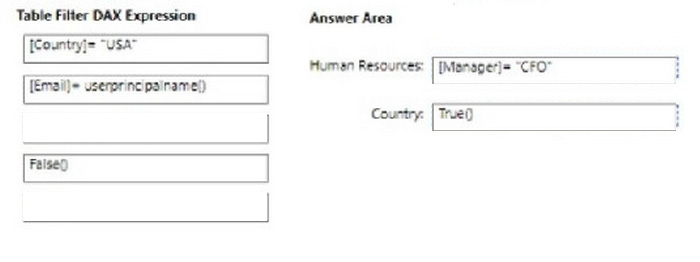
You plan to create a report that will display sales data from the last year for multiple regions
You need to restrict access to individual rows of the data on a per region-basis by using roles.
Which four actions should you perform in sequence?
To answer, move the appropriate actions from the list of actions to the answer area and arrange them in the correct order.
Select and Place:
-
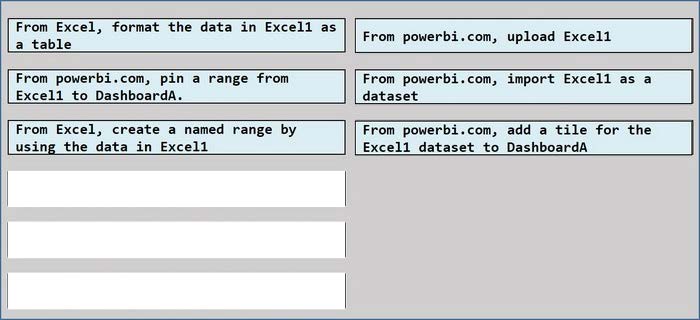
Question 218:
DRAG DROP
You have a Microsoft Exert spreadsheet named Excel1 that contains survey results.
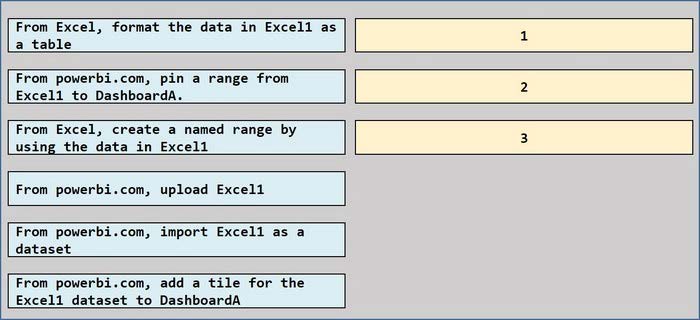
You have a Power Bl dashboard named DashboardA that has QandA enabled.
You need to ensure that users who can access DashboardA can ask Questions based on the contents of Excel 1 and pm visuals based on their queries to DashboardA. The solution must minimize development time.
Which three actions should you perform in sequence? To answer, move the appropriate actions from the list of actions to the answer area and arrange them in the correct order.
Select and Place:
-
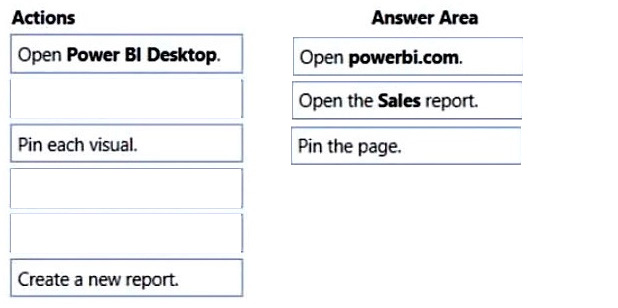
Question 219:
DRAG DROP
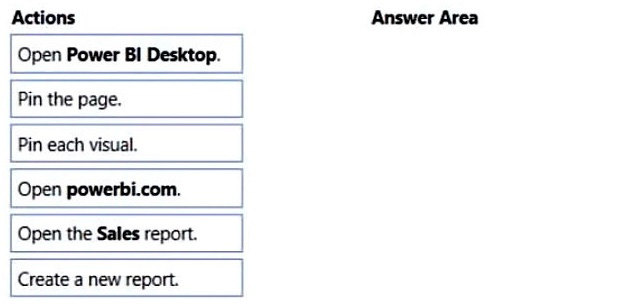
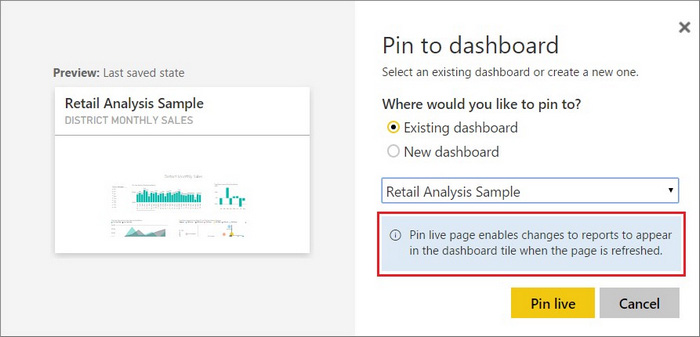
You have a Power Bl workspace that contains a single-page report named Sales.
You need to add all the visuals from Sales to a dashboard. The solution must ensure that additional visuals added to the page are added automatically to the dashboard.
Which three actions should you perform in sequence? To answer, move the appropriate actions from the list of actions to the answer area and arrange them in the correct order.
Select and Place:
-
Question 220:
DRAG DROP
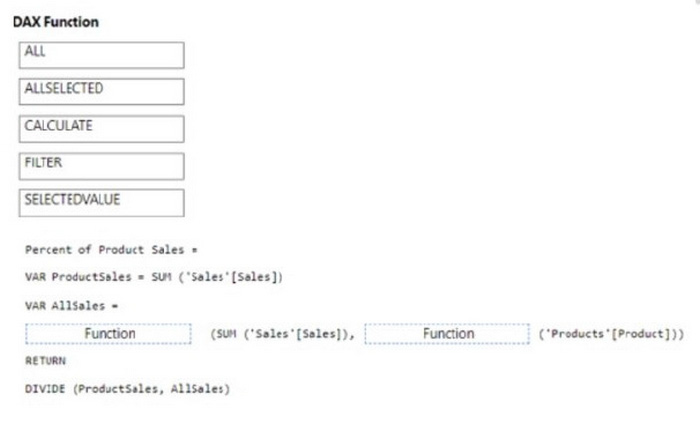
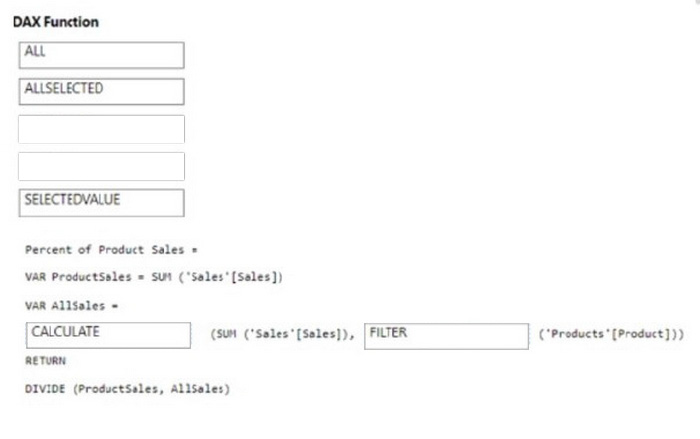
You have a Power B1 data model that contains two tables named Products and Sales.
A one-to-many relationship exists between the tables.
You have a report that contains a report-level filter for Products.
You need to create a measure that will return the percent of total sales for each product. The measure must respect the report-level filter when calculating the total.
How should you complete the DAX measure? To answer drag the appropriate DAX functions to the correct targets- Each function may be used once, more than once, or not at all the spirt bar between panes or scroll to view content
NOTE: Each correct selection is worth one point
Select and Place:
Related Exams:
62-193
Technology Literacy for Educators70-243
Administering and Deploying System Center 2012 Configuration Manager70-355
Universal Windows Platform – App Data, Services, and Coding Patterns77-420
Excel 201377-427
Excel 2013 Expert Part One77-725
Word 2016 Core Document Creation, Collaboration and Communication77-726
Word 2016 Expert Creating Documents for Effective Communication77-727
Excel 2016 Core Data Analysis, Manipulation, and Presentation77-728
Excel 2016 Expert: Interpreting Data for Insights77-731
Outlook 2016 Core Communication, Collaboration and Email Skills
Tips on How to Prepare for the Exams
Nowadays, the certification exams become more and more important and required by more and more enterprises when applying for a job. But how to prepare for the exam effectively? How to prepare for the exam in a short time with less efforts? How to get a ideal result and how to find the most reliable resources? Here on Vcedump.com, you will find all the answers. Vcedump.com provide not only Microsoft exam questions, answers and explanations but also complete assistance on your exam preparation and certification application. If you are confused on your PL-300 exam preparations and Microsoft certification application, do not hesitate to visit our Vcedump.com to find your solutions here.