Exam Details
Exam Code
:PL-300Exam Name
:Microsoft Power BI Data AnalystCertification
:Microsoft CertificationsVendor
:MicrosoftTotal Questions
:400 Q&AsLast Updated
:Mar 28, 2025
Microsoft Microsoft Certifications PL-300 Questions & Answers
-
Question 221:
DRAG DROP
Note: This question is a part of a series of questions that present the same scenario. For your convenience, the scenario is repeated in each question. Each question presents a different goal and answer choices, but the text of the scenario is
exactly the same in each question in this series.
Start of repeated scenario
You have a Microsoft SQL Server database that has the tables shown in the Database Diagram exhibit. (Click the Exhibit.)
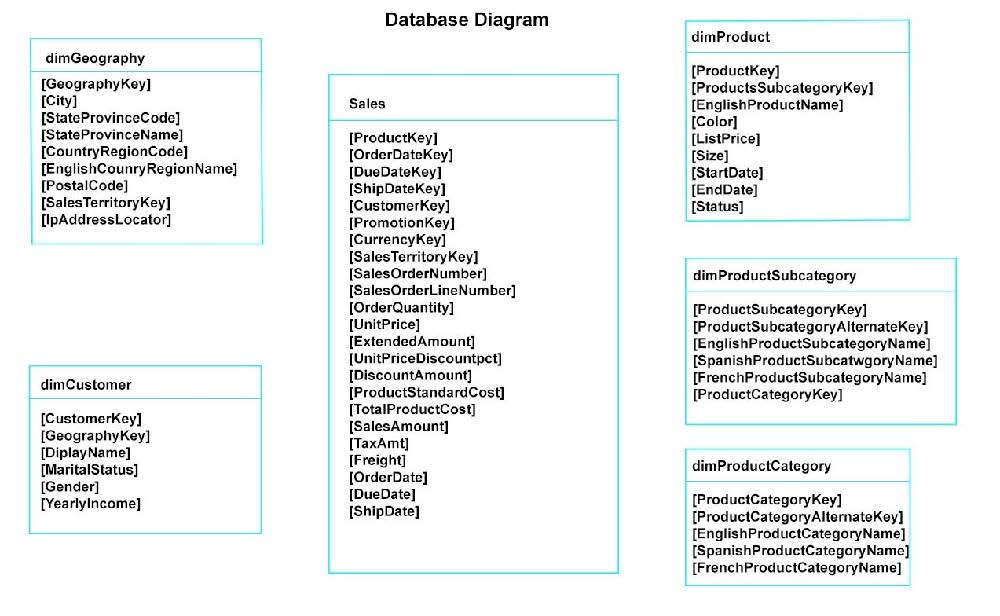
You plan to develop a Power BI model as shown in the Power BI Model exhibit. (Click the Exhibit).
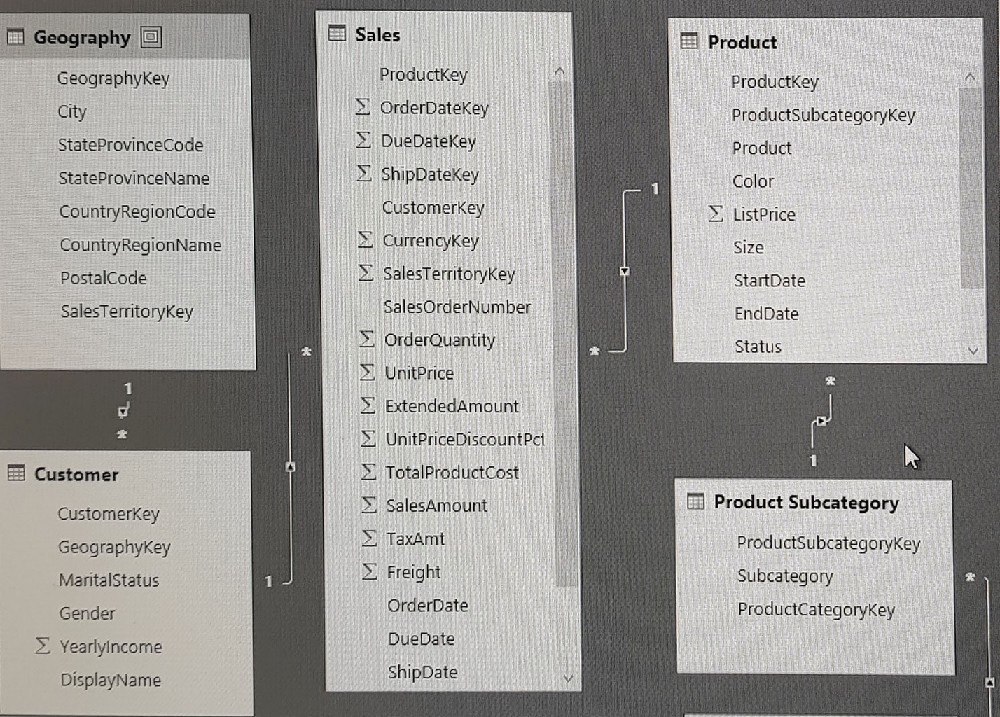
You plan to use Power BI to import data from 2013 to 2015.
Product Subcategory [Subcategory] contains NULL values.
End of repeated scenario.
You implement the Power BI model.
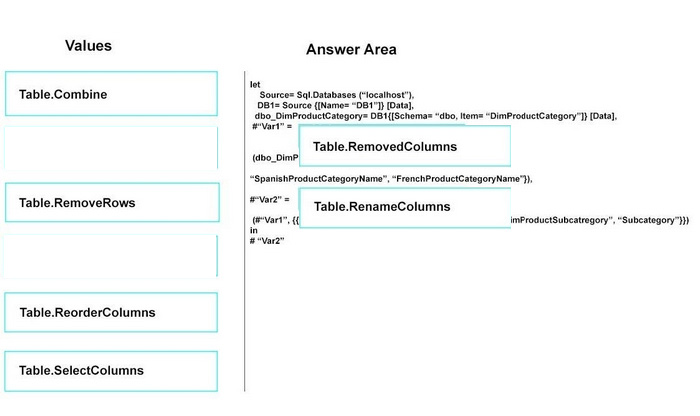
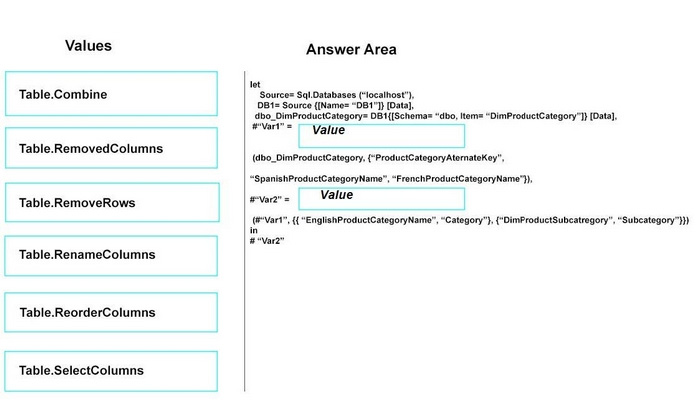
You need to edit the Product Category table query to match the desired Power BI model.
How should you complete the advanced query? To answer, drag the appropriate values to the correct targets. Each value may be used once, more than once, or not at all.
You may need to frag the split bar between panes or scroll to view content.
NOTE: Each correct selection is worth one point.
Select and Place:
-
Question 222:
DRAG DROP
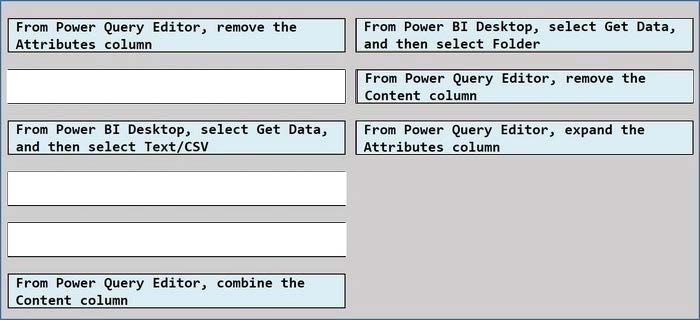
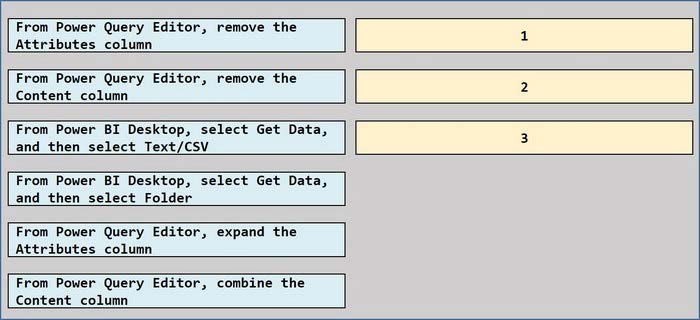
You have a folder that contains 100 CSV files.
You need to make the file metadata available as a single dataset by using Power Bi The solution must NOT store the data of the CSV files.
Which three actions should you perform in sequence. To answer, mow the appropriate actions from the list of actions to the answer area and arrange them m the correct order.
NOTE; More than one order of answer choices is correct. You will receive credit for any of the correct orders you select.
Select and Place:
-
Question 223:
DRAG DROP
You are creating a Power Bi model and report.
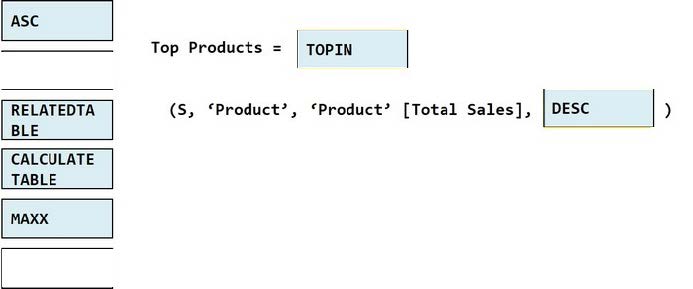
You have a single table in a data mode) named Product Product contains the following fields:
1.
ID
2.
Name
3.
Color
4.
Category
5.
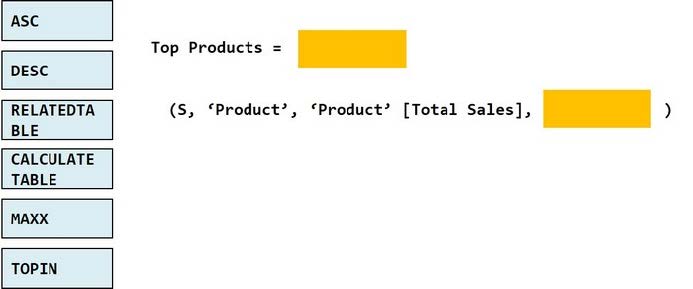
Total Sales You need to create a calculated table that shows only the top eight products based on the highest value in Total Sales. How should you complete the DAX expression? To answer, drag the appropriate values to the coned targets. Each value may be used once, more than once, or not at all. You may need to drag the split bar between panes or scroll to view
content.
Select and Place:
-
Question 224:
DRAG DROP
You have a Power Bl table named Customer that contains a field named Email Address.
You discover that multiple records contain the same email address.
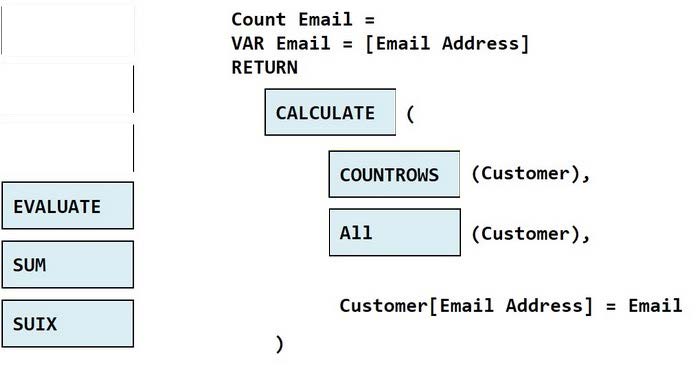
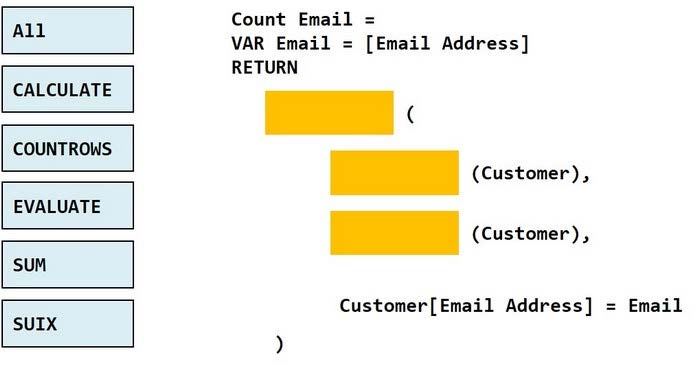
You need to create a calculated column to identify which records have duplicate email addresses.
How should you complete the OAX expression for the calculated column? To answer, drag the appropriate values to the correct targets. Each value may be used once, more than once, or not at all. You may need to drag the split bar between
panes or scroll to view content
NOTE: Each correct selection is worth one point.
Select and Place:
-
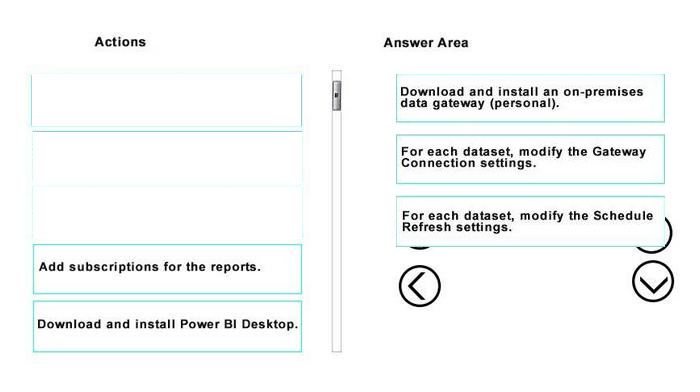
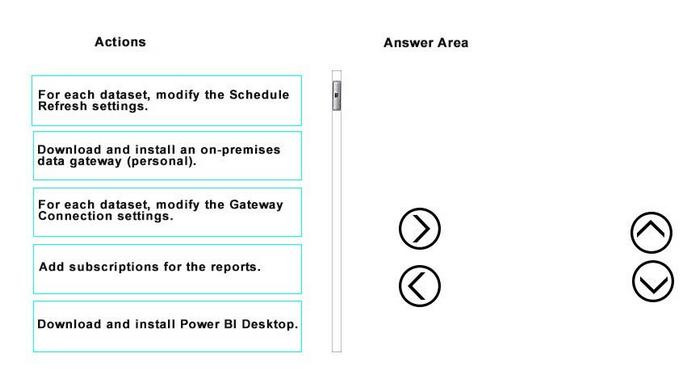
Question 225:
DRAG DROP
You have a Microsoft Excel workbook that contains two tables.
From Power BI, you create a dashboard that displays data from the tables.
You update the tables each day.
You need to ensure that the virtualizations in the dashboard are updated daily.
Which three actions should you perform in sequence? To answer, move the appropriate actions from the list of actions to answer area and arrange them in the correct order.
Select and Place:
-
Question 226:
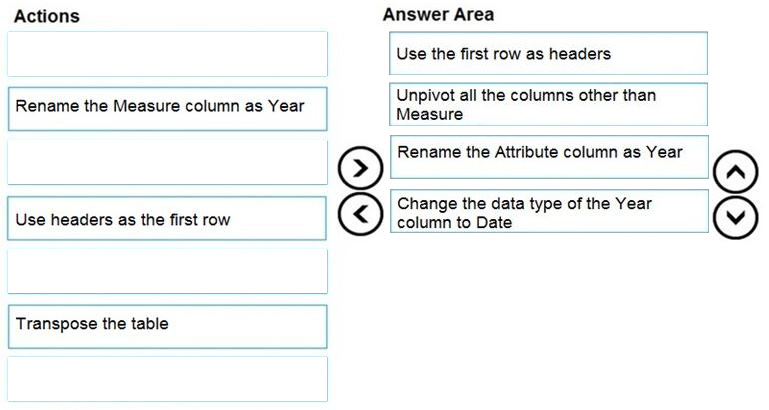
DRAG DROP
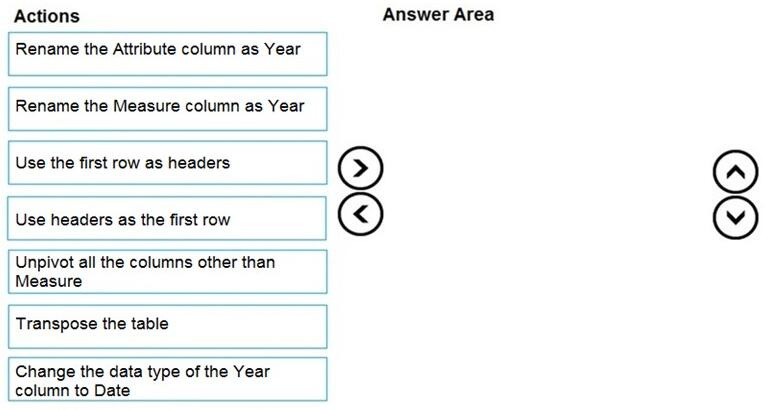
You are preparing a financial report in Power BI.
You connect to the data stored in a Microsoft Excel spreadsheet by using Power Query Editor as shown in the following exhibit.

You need to prepare the data to support the following:
1.
Visualizations that include all measures in the data over time
2.
Year-over-year calculations for all the measures
Which four actions should you perform in sequence? To answer, move the appropriate actions from the list of actions to the answer area and arrange them in the correct order.
Select and Place:
-
Question 227:
DRAG DROP
You have a Power BI model that contains a table named Sales. Sales has the following three measures:
A measure named Total Sales Last Year that displays the sales from the previous calendar year. The current value is 32.89 million. A measure named Total Sales This Year that displays the sales from the current calendar year. The current value is 11.69 million. A measure named Total Sales Difference that uses a DAX formula of Sales[Last Year] ?Sales[This Year].
You need to create the following visualization.
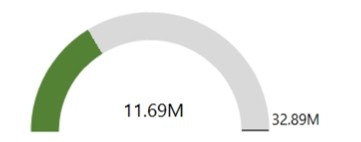
How should you configure the visualization? To answer, drag the appropriate measures to the correct fields. Each value may be used once, more than once, or not at all. You may need to drag the split bar between panes or scroll to view content.
NOTE: Each correct selection is worth one point.
Select and Place:

-
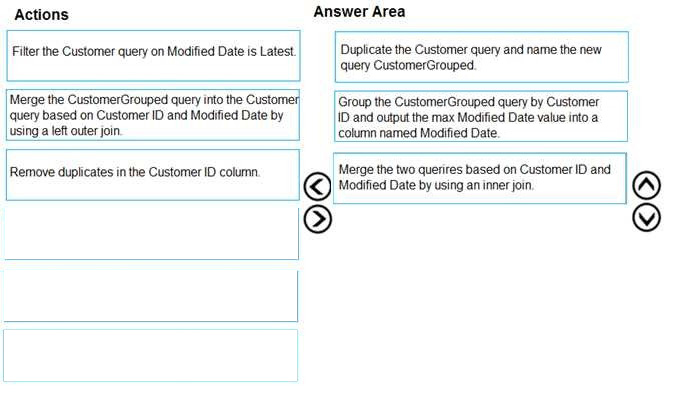
Question 228:
DRAG DROP
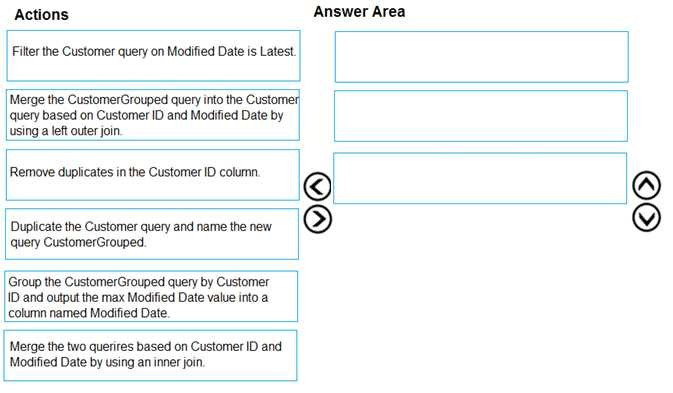
You have a query named Customer that imports CSV files from a data lake. The query contains 500 rows as shown in the exhibit. (Click the Exhibit tab.)
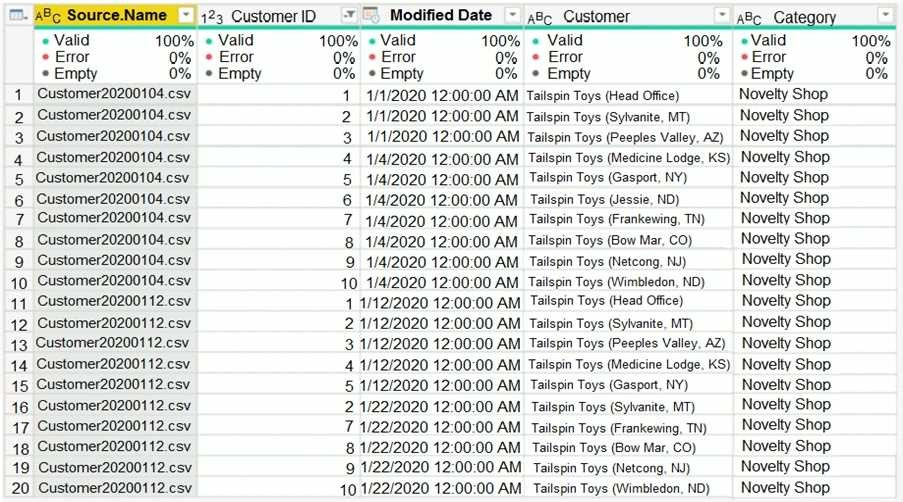
Each file contains deltas of any new or modified rows from each load to the data lake.
Multiple files can have the same customer ID.
You need to keep only the last modified row for each customer ID.
Which three actions should you perform in sequence? To answer, move the appropriate actions from the list of actions to the answer area and arrange them in the correct order.
Select and Place:
-
Question 229:
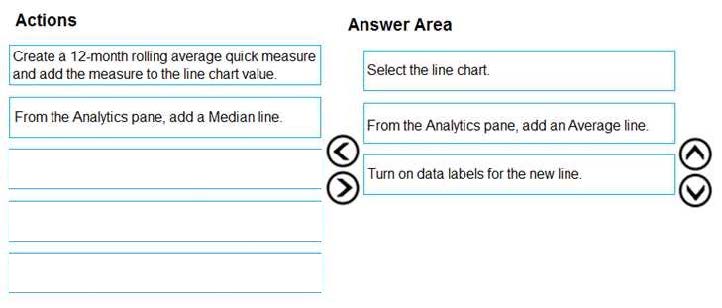
DRAG DROP
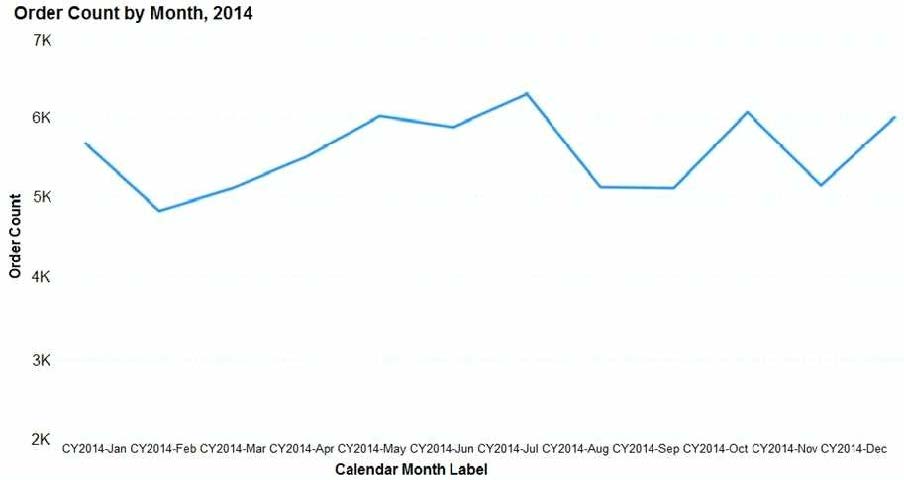
You have the line chart shown in the exhibit. (Click the Exhibit tab.)
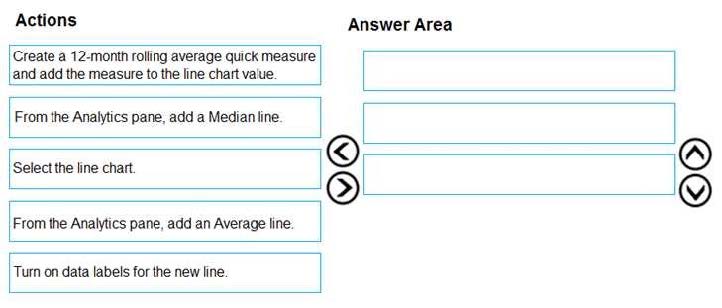
You need to modify the chart to meet the following requirements:
1.
Identify months that have order counts above the mean.
2.
Display the mean monthly order count.
Which three actions should you perform in sequence? To answer, move the appropriate actions from the list of actions to the answer area and arrange them in the correct order.
Select and Place:
-
Question 230:
DRAG DROP
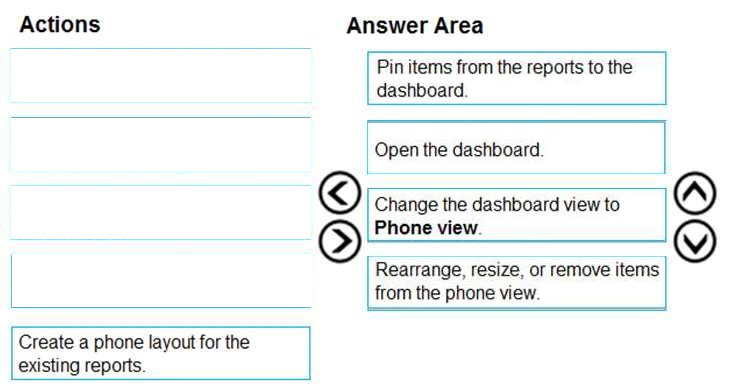
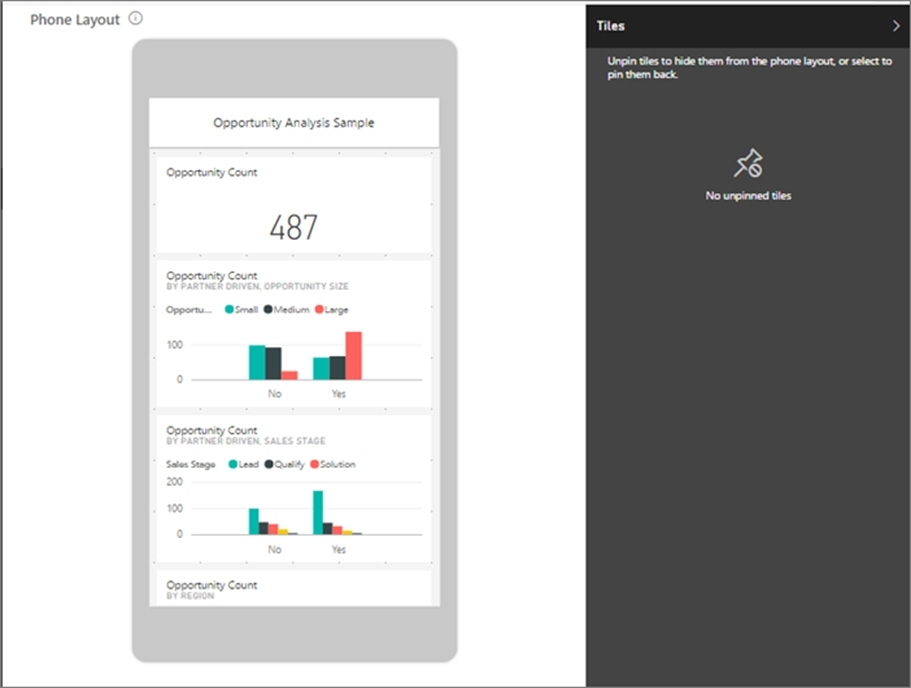
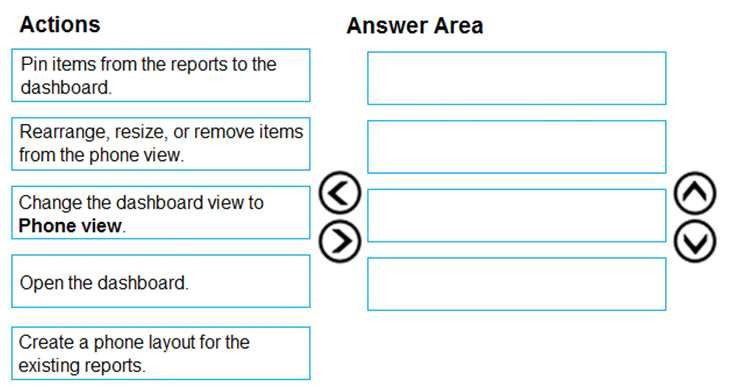
You are using existing reports to build a dashboard that will be viewed frequently in portrait mode on mobile phones.
You need to build the dashboard.
Which four actions should you perform in sequence? To answer, move the appropriate actions from the list of actions to the answer area and arrange them in the correct order.
Select and Place:
Related Exams:
62-193
Technology Literacy for Educators70-243
Administering and Deploying System Center 2012 Configuration Manager70-355
Universal Windows Platform – App Data, Services, and Coding Patterns77-420
Excel 201377-427
Excel 2013 Expert Part One77-725
Word 2016 Core Document Creation, Collaboration and Communication77-726
Word 2016 Expert Creating Documents for Effective Communication77-727
Excel 2016 Core Data Analysis, Manipulation, and Presentation77-728
Excel 2016 Expert: Interpreting Data for Insights77-731
Outlook 2016 Core Communication, Collaboration and Email Skills
Tips on How to Prepare for the Exams
Nowadays, the certification exams become more and more important and required by more and more enterprises when applying for a job. But how to prepare for the exam effectively? How to prepare for the exam in a short time with less efforts? How to get a ideal result and how to find the most reliable resources? Here on Vcedump.com, you will find all the answers. Vcedump.com provide not only Microsoft exam questions, answers and explanations but also complete assistance on your exam preparation and certification application. If you are confused on your PL-300 exam preparations and Microsoft certification application, do not hesitate to visit our Vcedump.com to find your solutions here.
