Exam Details
Exam Code
:PL-300Exam Name
:Microsoft Power BI Data AnalystCertification
:Microsoft CertificationsVendor
:MicrosoftTotal Questions
:400 Q&AsLast Updated
:Mar 28, 2025
Microsoft Microsoft Certifications PL-300 Questions & Answers
-
Question 241:
HOTSPOT
You have a Power BI model that contains the following data.

The Date table relates to the Sales table by using the Date columns.
You need to create a calculated table that v/ill contain the following:
Hot Area:

-
Question 242:
HOTSPOT
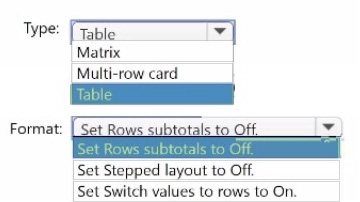
You have a Power B1 report that contains the table visual shown in the following exhibit.
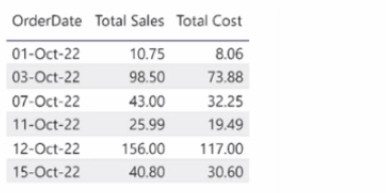
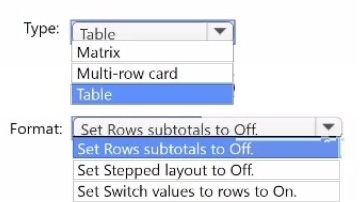
You need to modify the visual to display as shown in the following exhibit.

How should you configure the visual? To answer, select the appropriate options in the answer area. NOTE: Each correct selection is worth one point.
Hot Area:
-
Question 243:
HOTSPOT
You have a Power B1 report that contains the fields shown in the following exhibit.
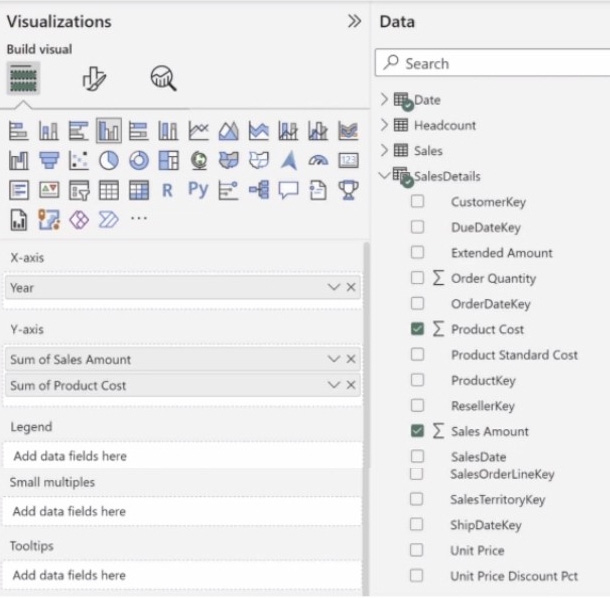
Use the drop-down menus to select the answer choice that completes each statement based on the information presented in the graphic. NOTE: Each correct selection is worth one point.
Hot Area:

-
Question 244:
HOTSPOT
You have the Power Bl data model shown in the following exhibit.
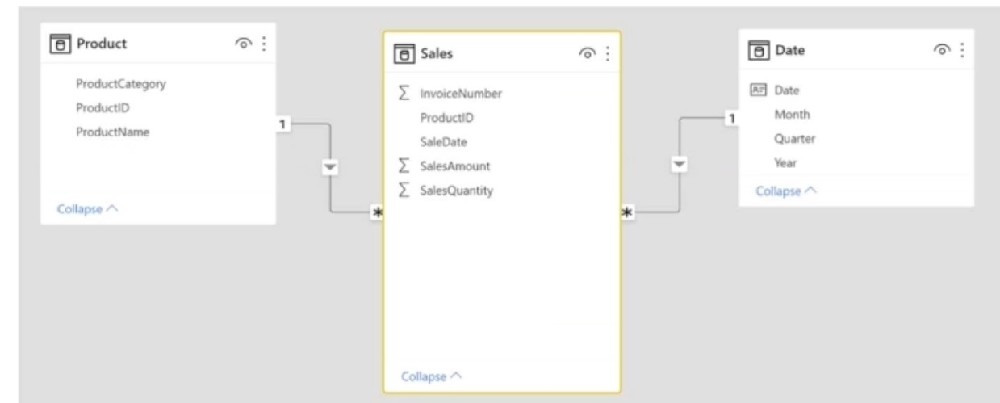
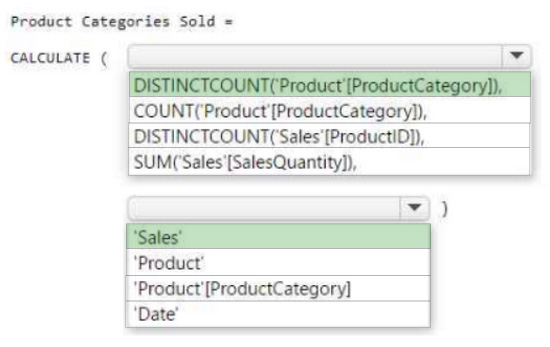
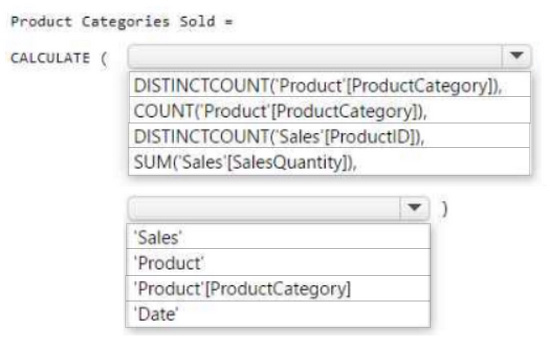
You need to create a measure to count the number of product categories that had products sold during a selected period. How should you complete the DAX expression? To answer, select the appropriate options in the answer area. NOTE: Each correct selection is worth one point.
Hot Area:
-
Question 245:
HOTSPOT
You are creating a Power Bi model in Power BI Desktop
You need to create a calculated table named Numbers that will contain all the integers from -100 to 100.
How should you complete the DAX calculation?
To answer, select the appropriate options in the answer area. NOTE Each correct selection is worth one point.
Hot Area:

-
Question 246:
HOTSPOT
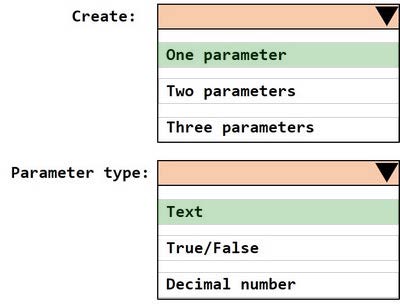
You have the Azure SQL databases shown in the following table.

You plan to build a single PBIX file to meet the following requirements:
1.
Data must be consumed from the database that corresponds to each stage of the development lifecycle.
2.
Power Bl deployment pipelines must NOT be used.
3.
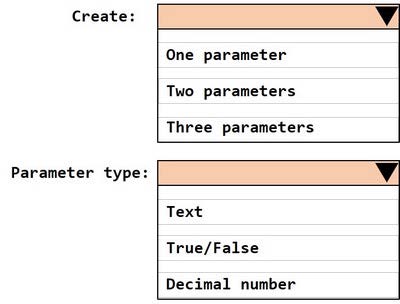
The solution must minimize administrative effort.
What should you do? To answer, select the appropriate options in the answer area.
Hot Area:
-
Question 247:
HOTSPOT
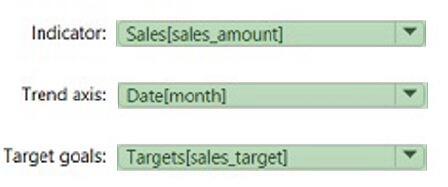
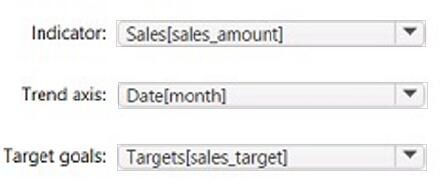
You need to create a visualization to meet the reporting requirements of the sales managers.
How should create the Visualization? TO answer, select the appropriate options in the answer area.
Hot Area:
-
Question 248:
HOTSPOT
You have the Power BI data model shown in the following exhibit.

Select the appropriate yes or no.
Hot Area:

-
Question 249:
HOTSPOT
You have a Power BI imported dataset that contains the data model shown in the following exhibit.
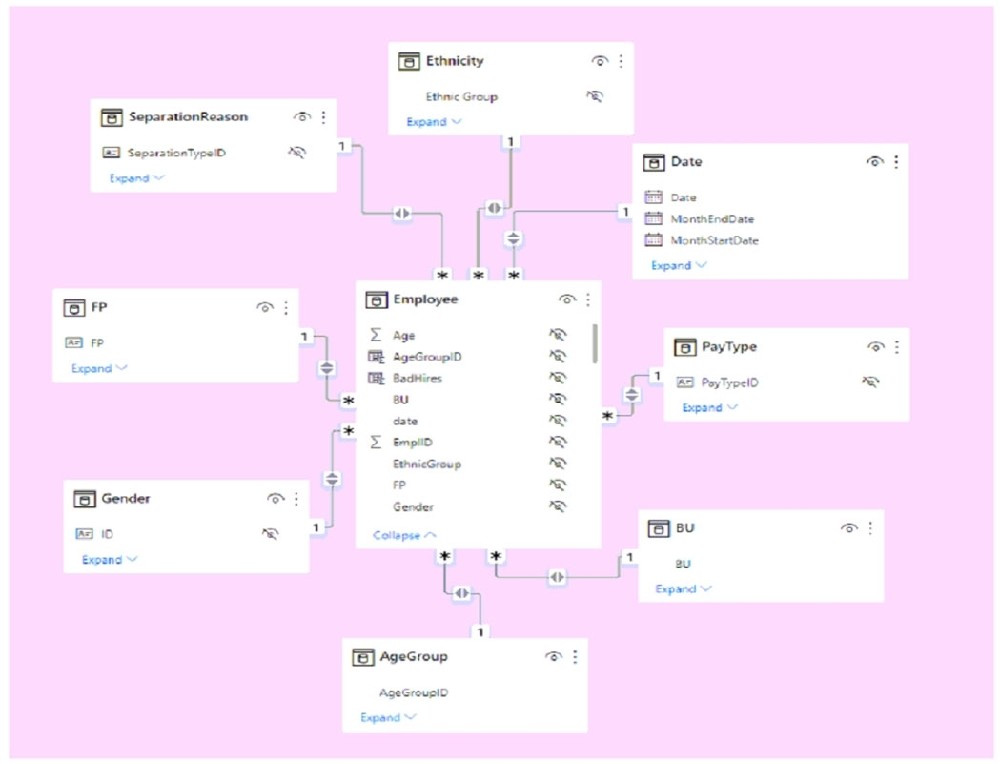
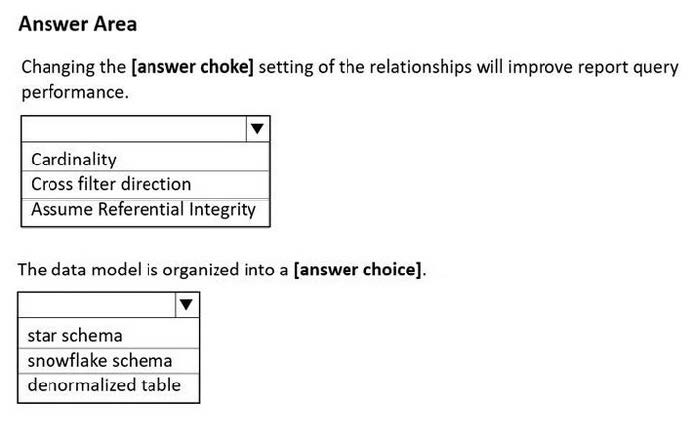
Use the drop-down menus to select the answer choice that completes each statement based on the information presented in the graphic. NOTE: Each correct selection is worth one point.
Hot Area:
-
Question 250:
HOTSPOT
You have a Power BI model that contains a table named Date. The table has the following columns.
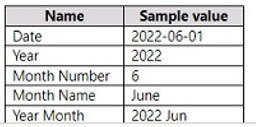
Hot Area:

Related Exams:
62-193
Technology Literacy for Educators70-243
Administering and Deploying System Center 2012 Configuration Manager70-355
Universal Windows Platform – App Data, Services, and Coding Patterns77-420
Excel 201377-427
Excel 2013 Expert Part One77-725
Word 2016 Core Document Creation, Collaboration and Communication77-726
Word 2016 Expert Creating Documents for Effective Communication77-727
Excel 2016 Core Data Analysis, Manipulation, and Presentation77-728
Excel 2016 Expert: Interpreting Data for Insights77-731
Outlook 2016 Core Communication, Collaboration and Email Skills
Tips on How to Prepare for the Exams
Nowadays, the certification exams become more and more important and required by more and more enterprises when applying for a job. But how to prepare for the exam effectively? How to prepare for the exam in a short time with less efforts? How to get a ideal result and how to find the most reliable resources? Here on Vcedump.com, you will find all the answers. Vcedump.com provide not only Microsoft exam questions, answers and explanations but also complete assistance on your exam preparation and certification application. If you are confused on your PL-300 exam preparations and Microsoft certification application, do not hesitate to visit our Vcedump.com to find your solutions here.

