Exam Details
Exam Code
:PL-300Exam Name
:Microsoft Power BI Data AnalystCertification
:Microsoft CertificationsVendor
:MicrosoftTotal Questions
:400 Q&AsLast Updated
:Mar 28, 2025
Microsoft Microsoft Certifications PL-300 Questions & Answers
-
Question 251:
HOTSPOT
The table has the following columns.
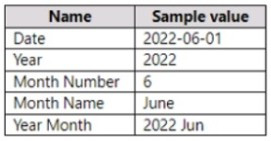
You need to add a column that will be used to sort the Year Month column chronologically.
Hot Area:

-
Question 252:
HOTSPOT
You have a report in Power BI Desktop.
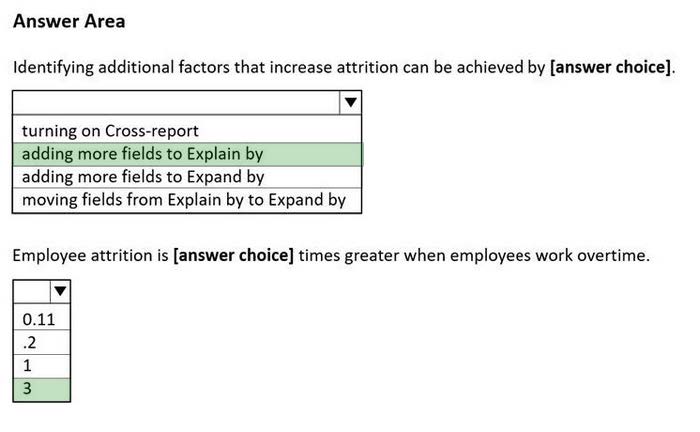
You add a key influencers visual as shown in the exhibit. (Click the Exhibit tab.)
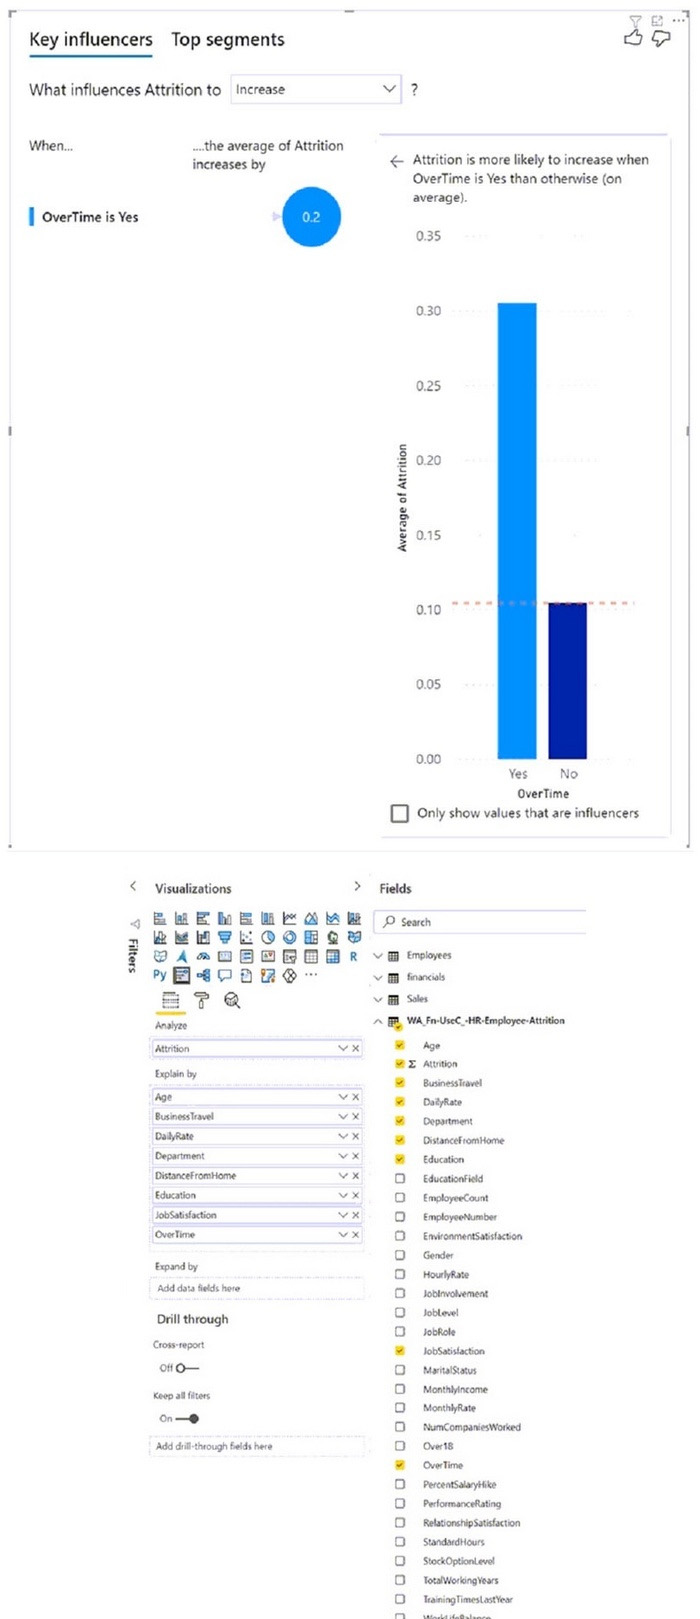
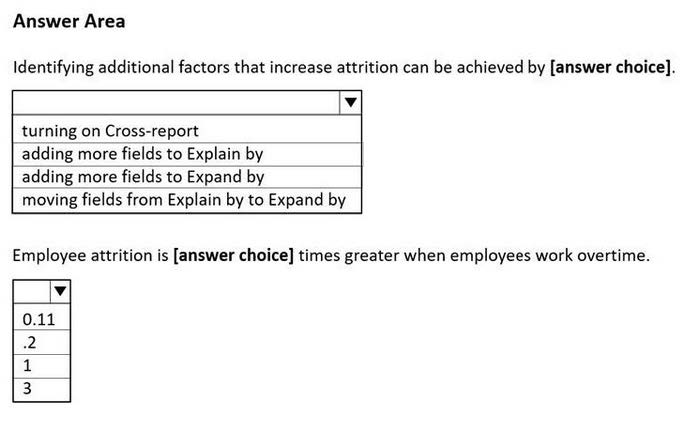
Use the drop-down menus to select the answer choice that completes each statement based on the information presented in the graphic. NOTE: Each correct selection is worth one point.
Hot Area:
-
Question 253:
HOTSPOT
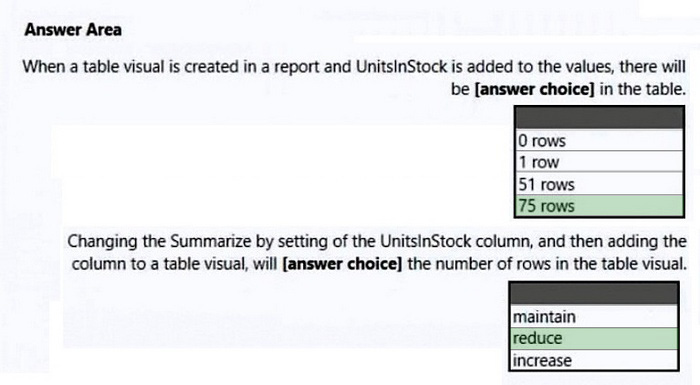
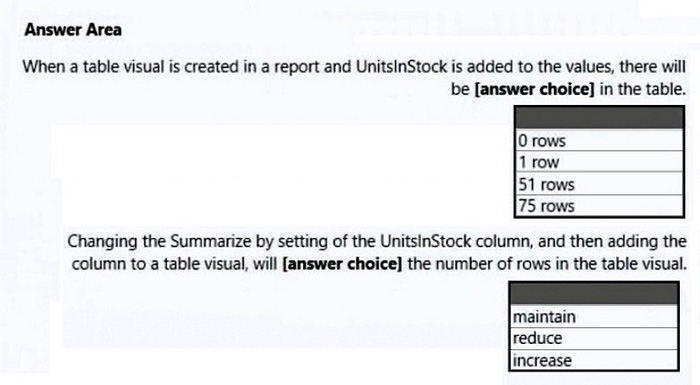
You have a column named UnitslnStock as shown in the following exhibit
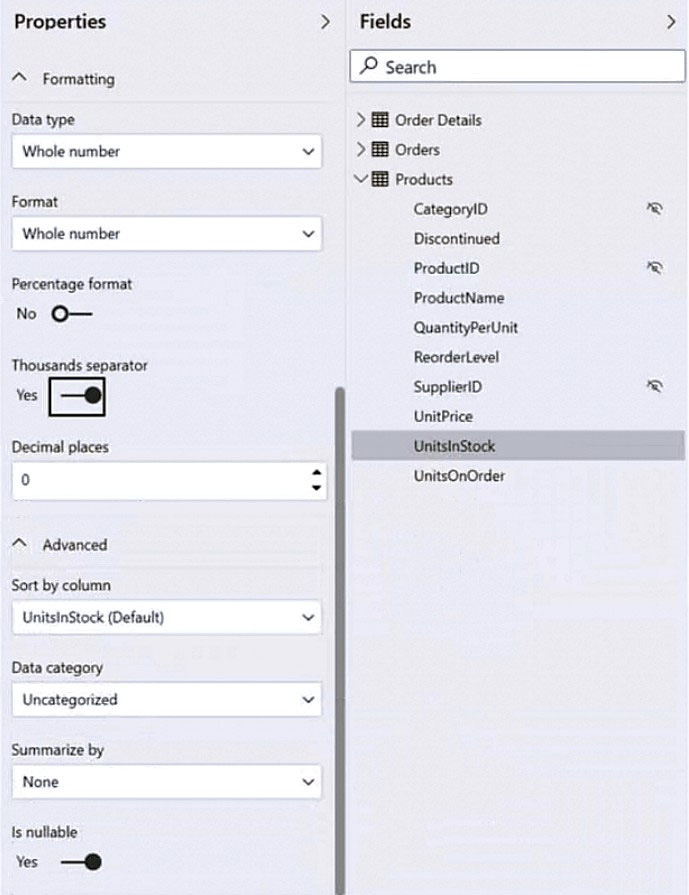
UnitsInStock has 75 non-null values, of which 51 are unique.
Use the drop-down menus to select the answer choice that completes each statement based on the information presented in the graphic.
NOTE: Each correct selection is worth one point.
Hot Area:
-
Question 254:
HOTSPOT
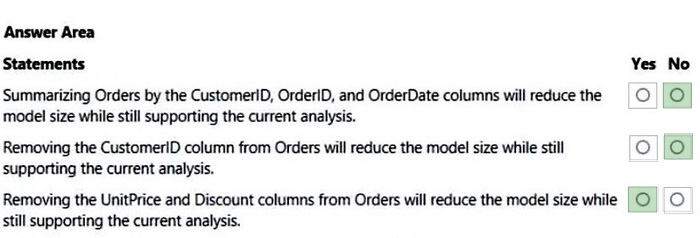
You have a Power Bl report named Orders that supports the following analysis:
1.
Total sales over time
2.
The count of orders over time
3.
New and repeat customer counts
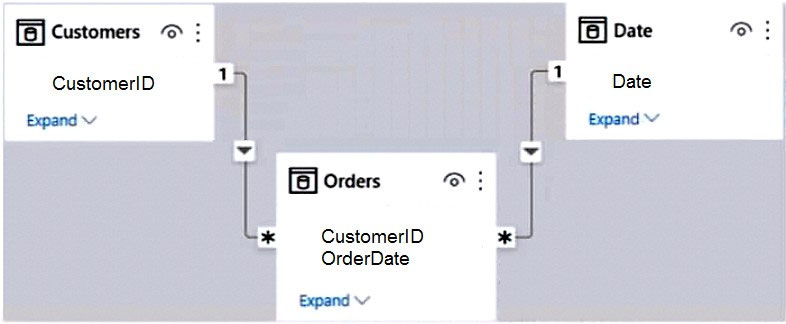
The data model size is nearing the limit for a dataset in shared capacity. The model view for the dataset is shown in the following exhibit.
The data view for the Orders table is shown in the following exhibit.
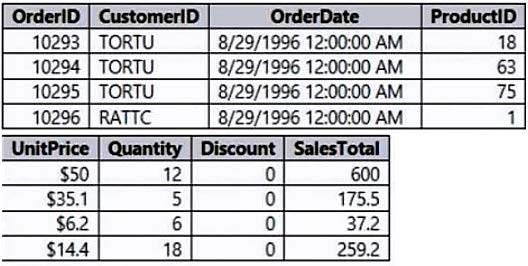
The Orders table relates to the Customers table by using the CustomerID column.
The Orders table relates to the Date table by using the OrderDate column.
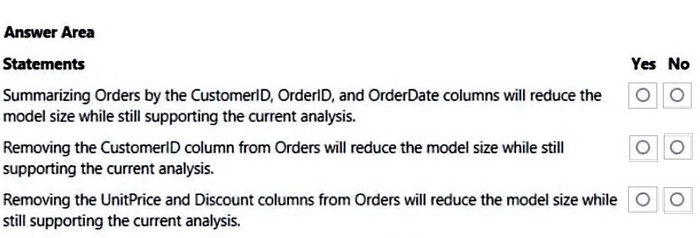
For each of the following statements, select Yes if the statement is true, Otherwise, select No.
NOTE: Each correct selection is worth one point.
Hot Area:
-
Question 255:
HOTSPOT
The data model must support the following analysis:

Total sales by product by month in which the order was placed Quantities sold by product by day on which the order was placed Number Of sales transactions by quarter in Which the order was placed For each Of the following statements, select Yes if the statement is true. Otherwise, select NO.
Hot Area:

-
Question 256:
HOTSPOT
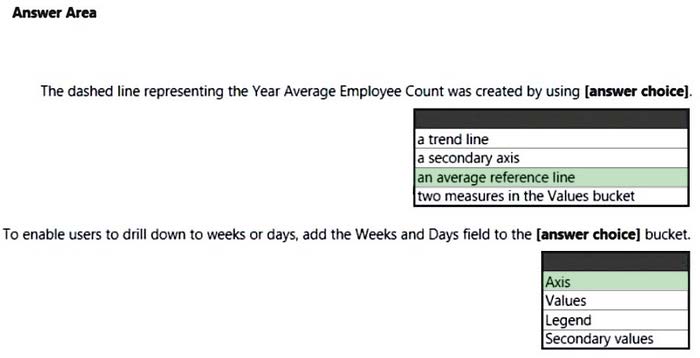
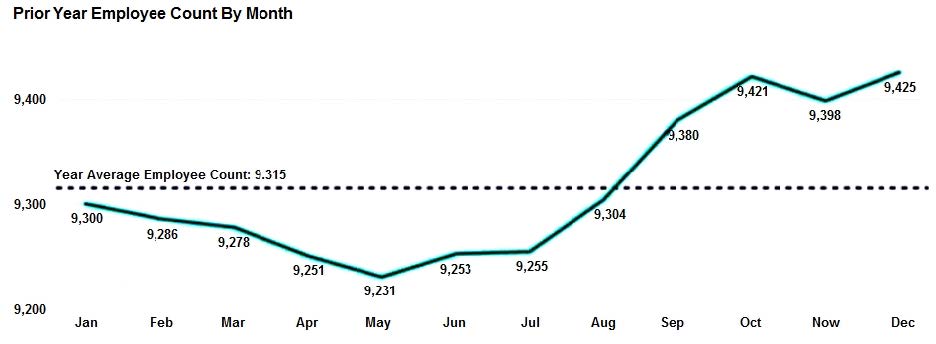
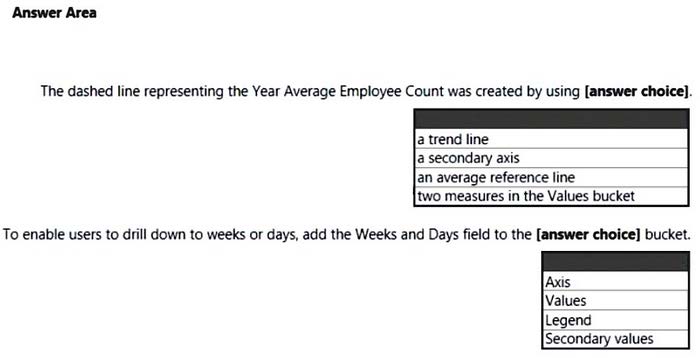
You are creating a line chart in a Power Bl report as shown in the following exhibit.
Use the drop-down menus to select the answer choice that completes each statement based on the information presented in the graphic.
NOTE: Each correct selection is worth one point.
Hot Area:
-
Question 257:
HOTSPOT
You are profiling data by using Power Query Editor.
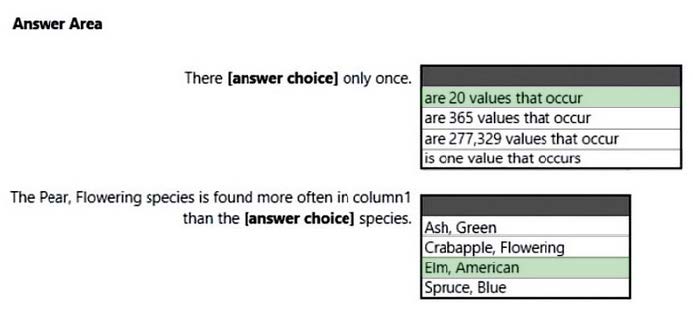
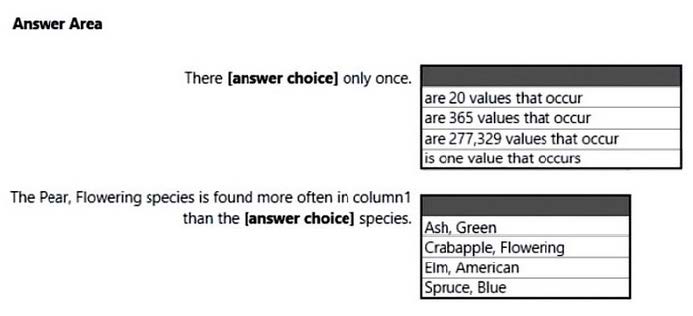
You have a table that contains a column named column1. Column statistics and Value distribution for column1 are shown in the following exhibit.
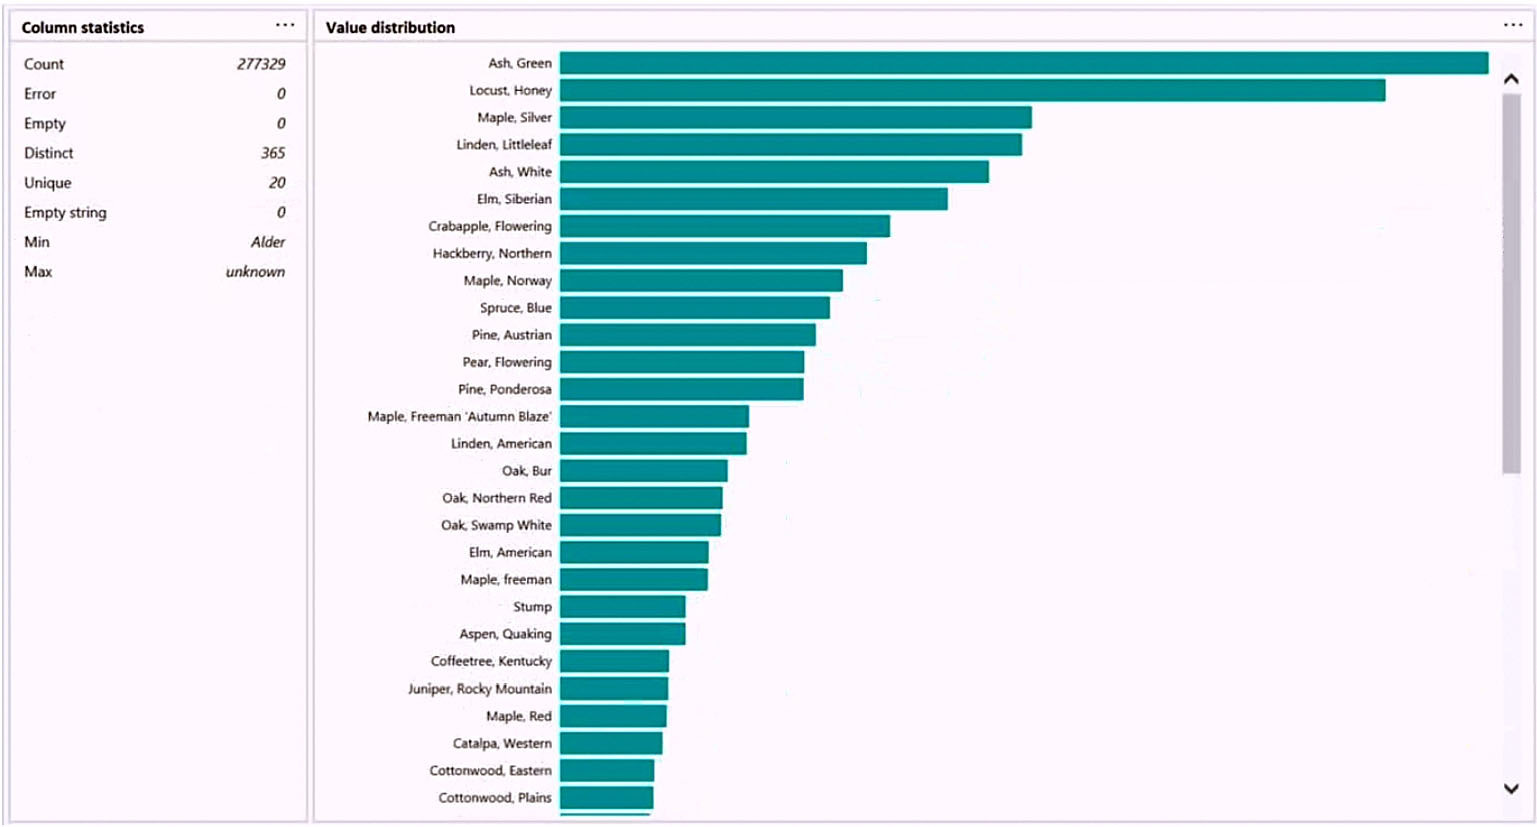
Use the drop-down menus to select the answer choice that completes each statement based on the information presented in the graphic. NOTE: Each correct selection is worth one point.
Hot Area:
-
Question 258:
HOTSPOT
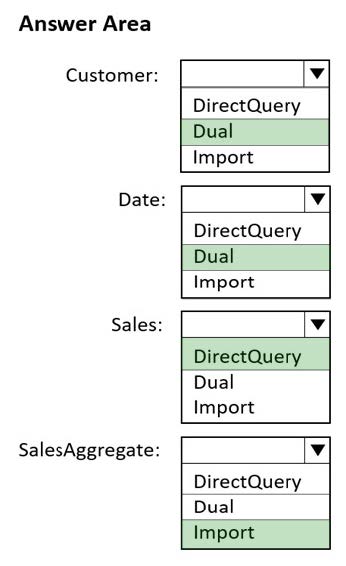
You plan to create the Power Bl model shown in the exhibit. (Click the Exhibit tab.)
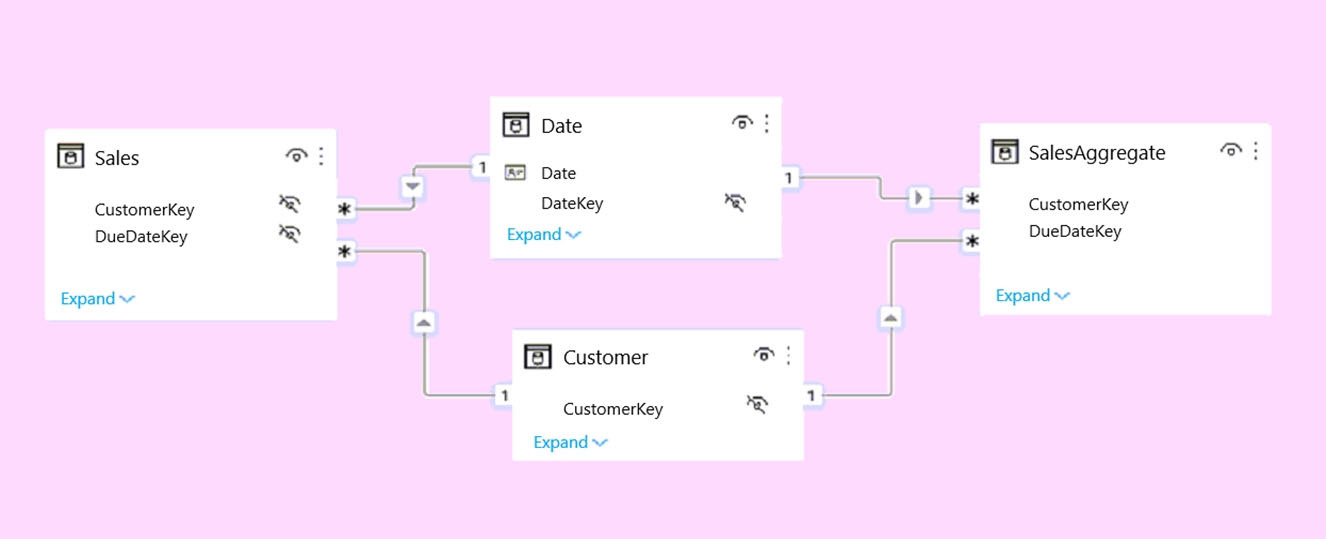
The data has the following refresh requirements:
1.
Customer must be refreshed daily.
2.
Date must be refreshed once every three years.
3.
Sales must be refreshed in near real time.
4.
SalesAggregate must be refreshed once per week.
You need to select the storage modes for the tables. The solution must meet the following requirements:
1.
Minimize the load times of visuals.
2.
Ensure that the data is loaded to the model based on the refresh requirements.
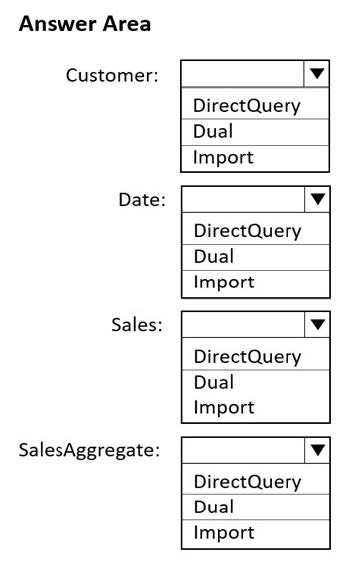
Which storage mode should you select for each table? To answer, select the appropriate options in the answer area. NOTE: Each correct selection is worth one point.
Hot Area:
-
Question 259:
HOTSPOT
You need to create a Power Bl report. The first page or the report must contain the following two views:
1.
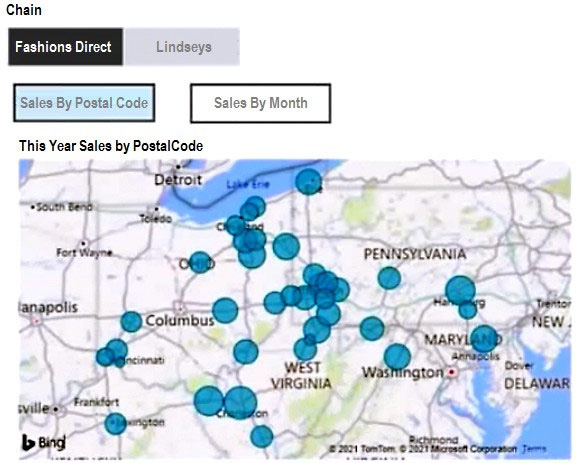
Sales By Postal Code
2.
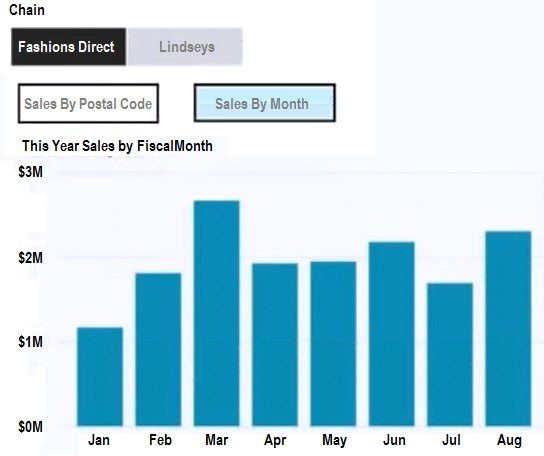
Sales by Month
Both views must display a slicer to select a value for a field named Chain.
The Sales By Postal Code view must display a map visual as shown in the following exhibit.
The Sales By Month view must display a column chart visual as shown in the following exhibit.
Users must be able to switch between the views by using buttons on the report page. The selected Chain field must be maintained when switching between views.
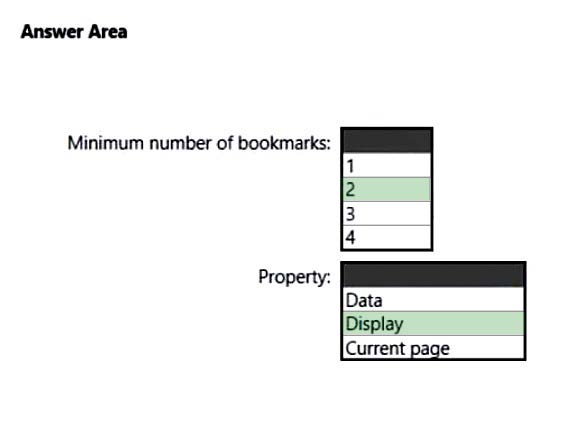
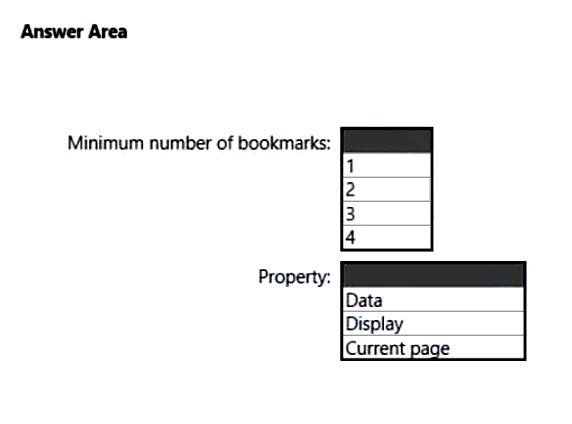
What is the minimum number of bookmarks required, and which property should you apply to each bookmark? To answer, select the appropriate options in the answer area.
NOTE: Each correct selection is worth one point.
Hot Area:
-
Question 260:
HOTSPOT
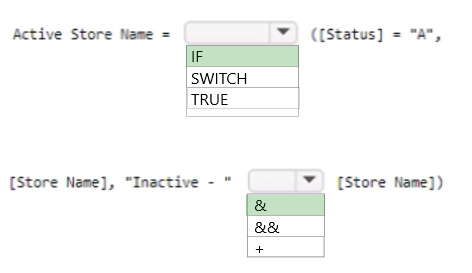
You have a Power 31 data model that contains a table named Stores. The table has the following columns:
1.
Store Name
2.
Open Date
3.
Status
4.
State
5.
City
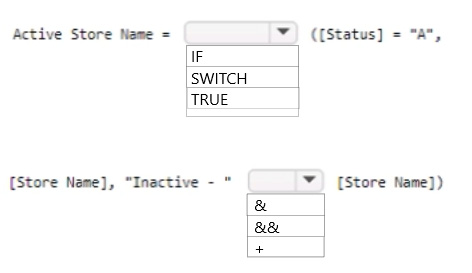
You need to create a calculated column named Active Store Name that meets the following requirements:
Hot Area:
Related Exams:
62-193
Technology Literacy for Educators70-243
Administering and Deploying System Center 2012 Configuration Manager70-355
Universal Windows Platform – App Data, Services, and Coding Patterns77-420
Excel 201377-427
Excel 2013 Expert Part One77-725
Word 2016 Core Document Creation, Collaboration and Communication77-726
Word 2016 Expert Creating Documents for Effective Communication77-727
Excel 2016 Core Data Analysis, Manipulation, and Presentation77-728
Excel 2016 Expert: Interpreting Data for Insights77-731
Outlook 2016 Core Communication, Collaboration and Email Skills
Tips on How to Prepare for the Exams
Nowadays, the certification exams become more and more important and required by more and more enterprises when applying for a job. But how to prepare for the exam effectively? How to prepare for the exam in a short time with less efforts? How to get a ideal result and how to find the most reliable resources? Here on Vcedump.com, you will find all the answers. Vcedump.com provide not only Microsoft exam questions, answers and explanations but also complete assistance on your exam preparation and certification application. If you are confused on your PL-300 exam preparations and Microsoft certification application, do not hesitate to visit our Vcedump.com to find your solutions here.

