Exam Details
Exam Code
:PL-300Exam Name
:Microsoft Power BI Data AnalystCertification
:Microsoft CertificationsVendor
:MicrosoftTotal Questions
:400 Q&AsLast Updated
:Mar 28, 2025
Microsoft Microsoft Certifications PL-300 Questions & Answers
-
Question 271:
HOTSPOT
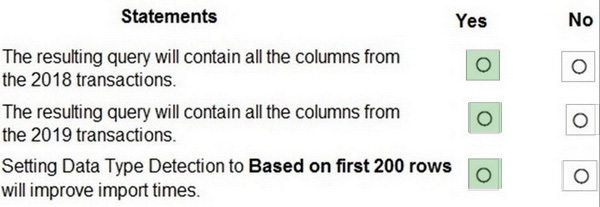
You have a folder of monthly transaction extracts.
You plan to create a report to analyze the transaction data.
You receive the following email message: "Hi. I've put 24 files of monthly transaction data onto the shared drive. File Transactions201901.csv through Transactions201912.csv have the latest set of columns, but files Transactions201801.csv
to Transactions201812.csv have an older layout without the extra fields needed for analysis. Each file contains 10 to 50 transactions."
You get data from the folder and select Combine and Load. The Combine Files dialog box is shown in the exhibit. (Click the Exhibit tab.)
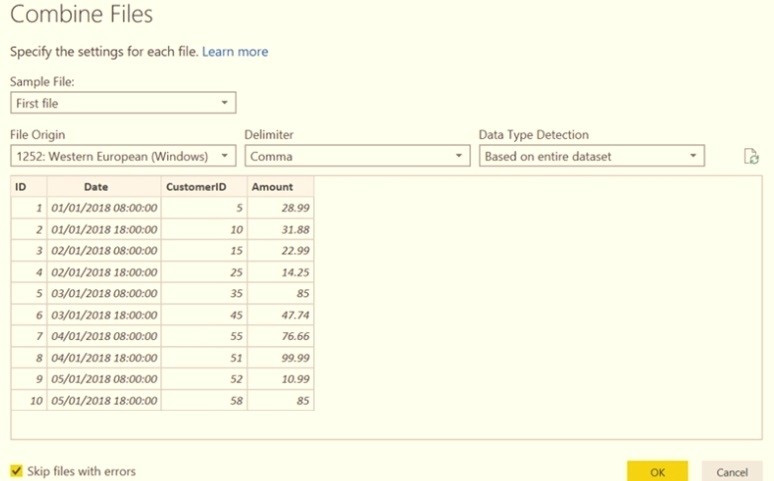
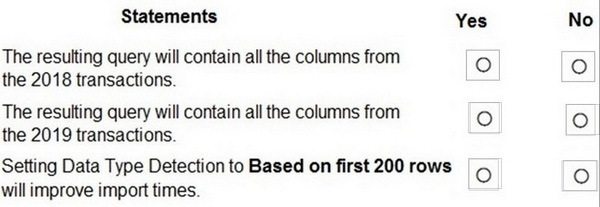
For each of the following statements, select Yes if the statement is true. Otherwise, select No. NOTE: Each correct selection is worth one point.
Hot Area:
-
Question 272:
HOTSPOT
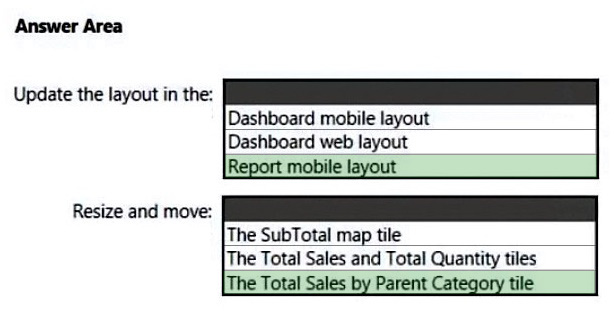
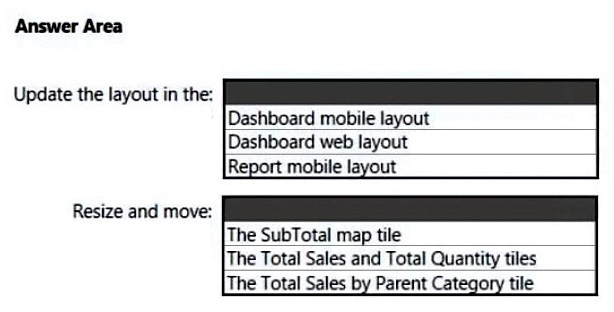
You have the Power Bi dashboard shown in the Dashboard exhibit (Click the Dashboard tab.)
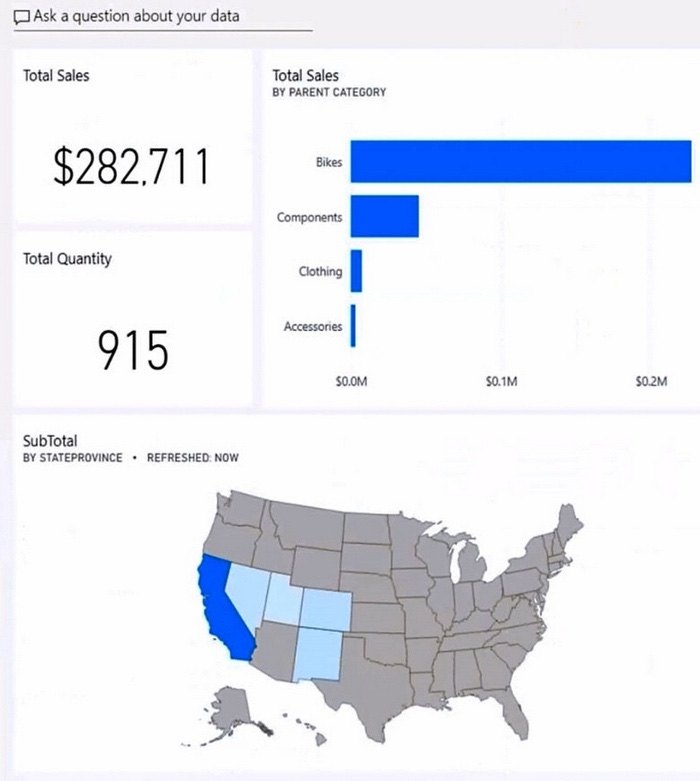
You need to ensure that when users view the dashboard on a mobile device, the dashboard appears as shown in the Mobile exhibit. (Click the Mobile tab.)
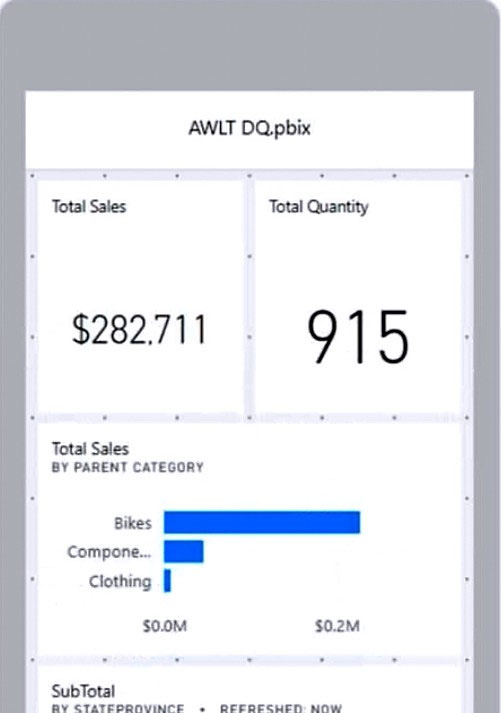
What should you do? To answer, select the appropriate options m the answer area NOTE: Each correct selection is worth one point.
Hot Area:
-
Question 273:
HOTSPOT
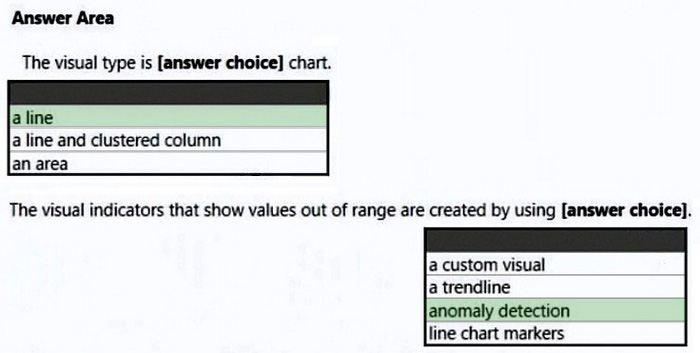
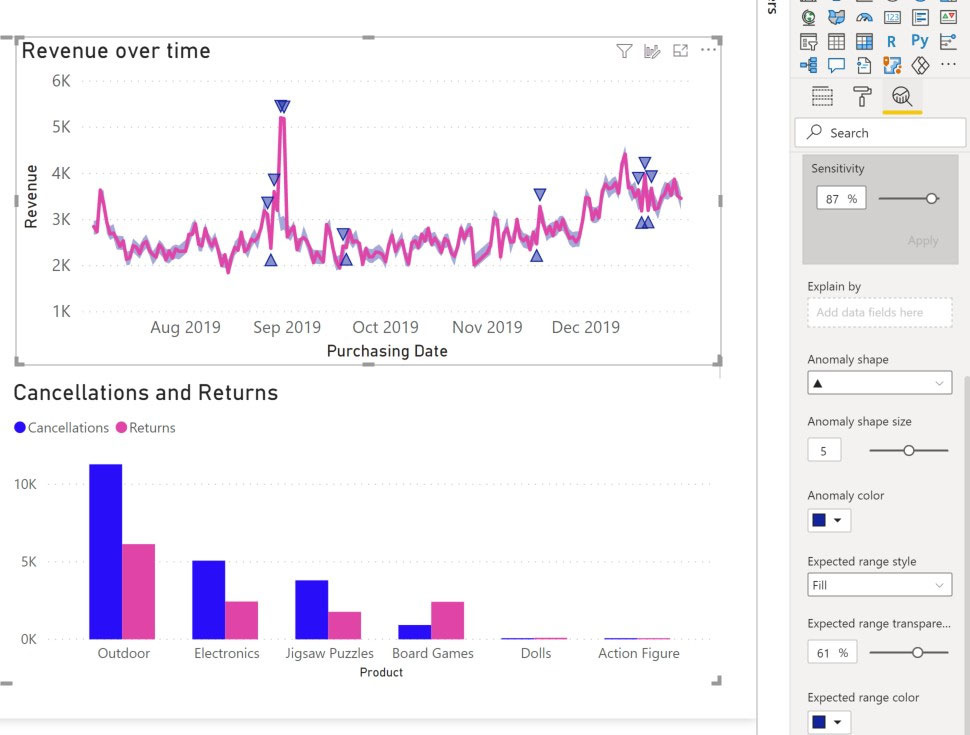
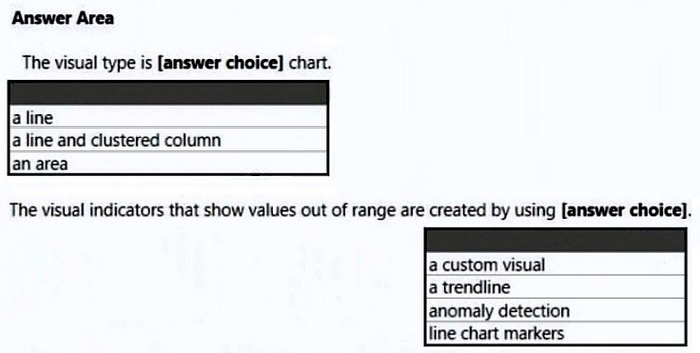
You have a Power Bl visual that uses indicators to show values that are out of range as shown in the following exhibit.
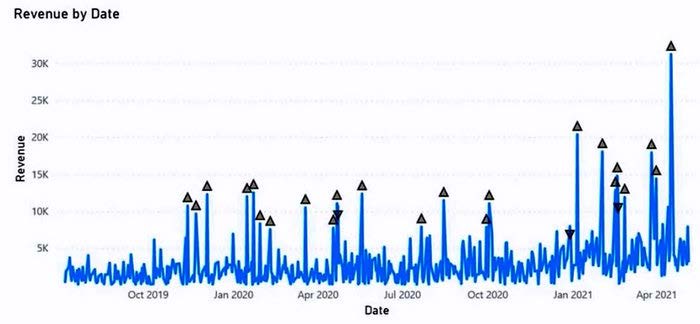
Use the drop-down menus to select the answer choice that completes each statement based on the information presented in the graphic. NOTE: Each correct selection is worth one point.
Hot Area:
-
Question 274:
HOTSPOT
You are creating reports in Power BI Desktop. The model has the following tables.

There is a relationship between the tables.
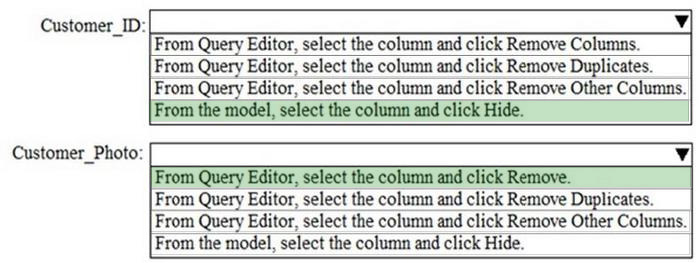
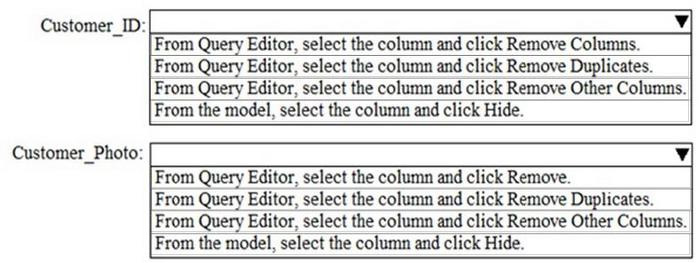
You plan to publish a report to the Power BI service that displays Order_amount by Order_date by Full_name.
You need to ensure that only the columns required for the report appear in Report View. The solution must minimize the size of the dataset that is published.
How should you configure the columns in Power BI Desktop? To answer, select the appropriate options in the answer area.
NOTE: Each correct selection is worth one point.
Hot Area:
-
Question 275:
HOTSPOT
You have a Power BI model that has the following tables:
Product (Product_id, Product_Name)
Sales (Order_id, Order_Date, Product_id, Salesperson_id, Sales_Amount) Salesperson (Salesperson_id, Salesperson_name, address)
You plan to create the following measure.
Measure1 = DISTINCTCOUNT(Sales[ProductID])
You need to create the following relationships:
1.
Sales to Product
2.
Sales to Salesperson
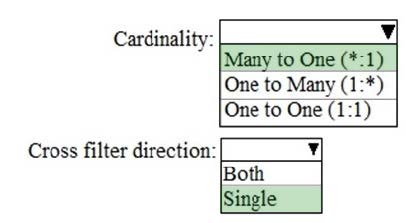
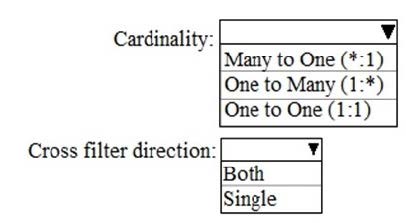
The solution must ensure that you can use Measure1 to display the count of products sold by each salesperson.
How should you configure the relationships? To answer, select the appropriate options in the answer area.
NOTE: Each correct selection is worth one point.
Hot Area:
-
Question 276:
HOTSPOT
You have a report in Power BI Desktop as shown in the following exhibit.
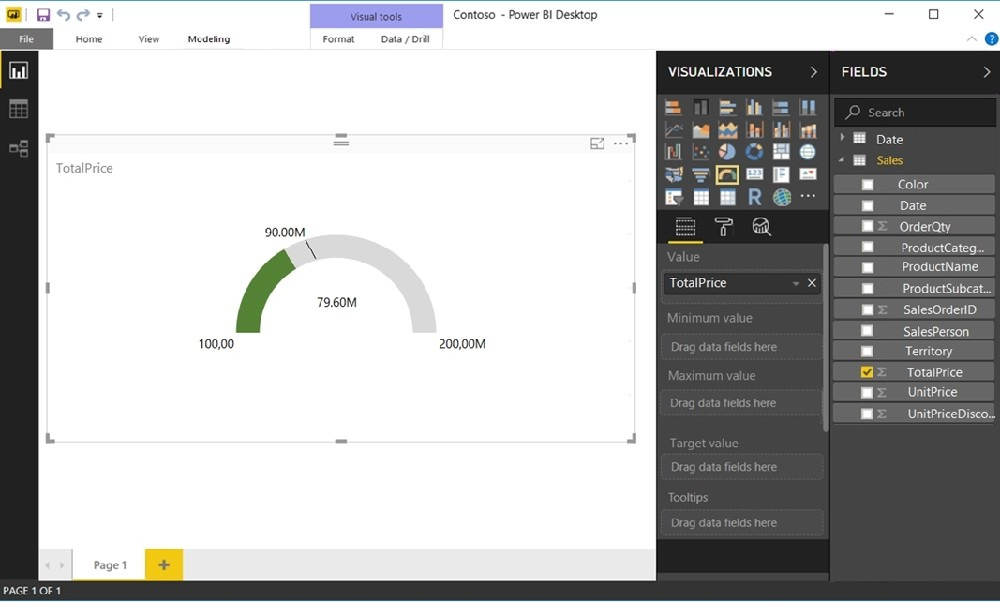
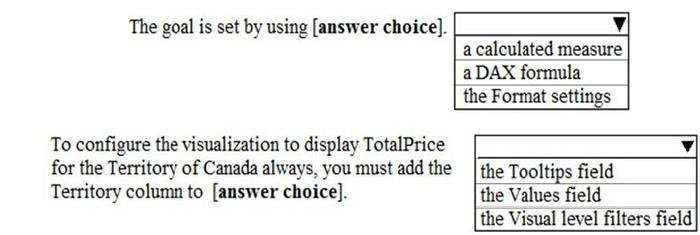
Use the drop-down menus to select the answer choice that completes each statement based on the information presented in the graphic. Note: Each correct selection is worth one point.
Hot Area:
-
Question 277:
HOTSPOT
You are profiling data by using Power Query Editor.
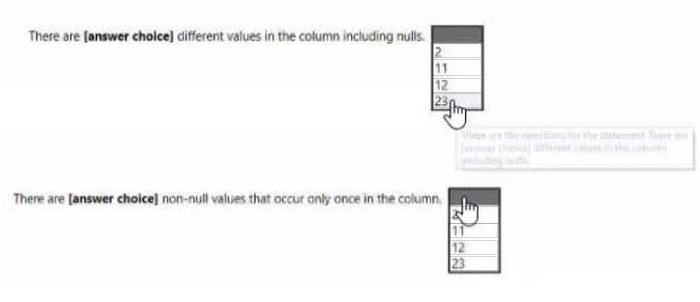
The AddressLine2 column in a table named Address is shown in the following exhibit.
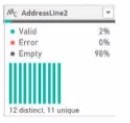
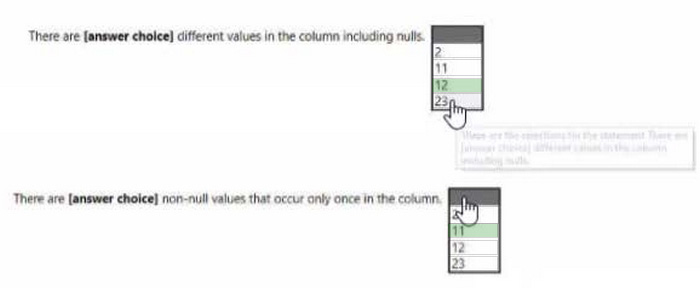
Use the drop-down menus to select the answer choice that completes each statement based on the information presented in the graphic. NOTE: Each correct selection is worth one point.
Hot Area:
-
Question 278:
HOTSPOT
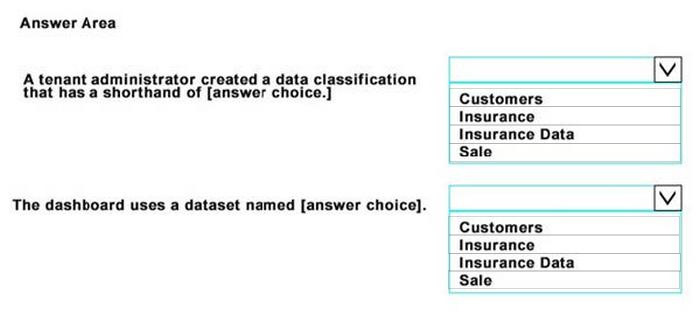
You open powerbi.com as shown in the following exhibit.
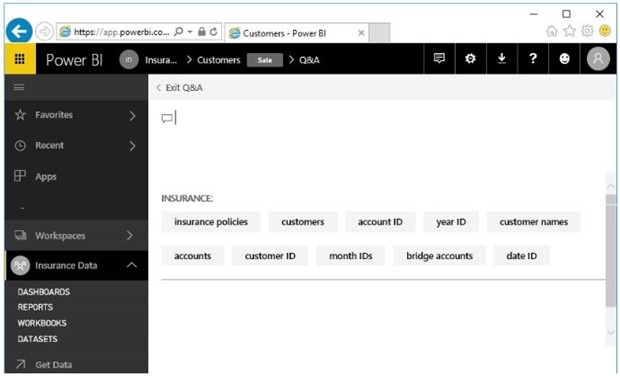
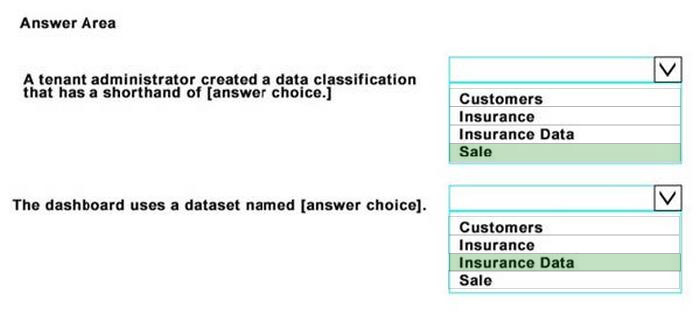
Use the drop-down menus to select the answer choice that completes each statement based on the information presented in the graphic. NOTE: Each correct selection is worth one point.
Hot Area:
-
Question 279:
HOTSPOT
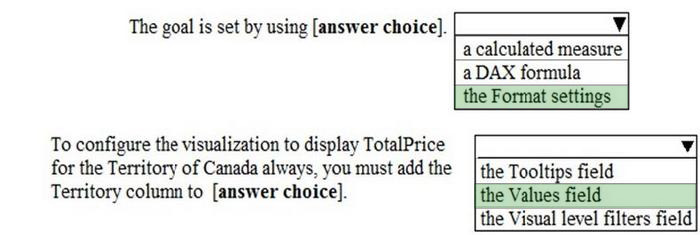
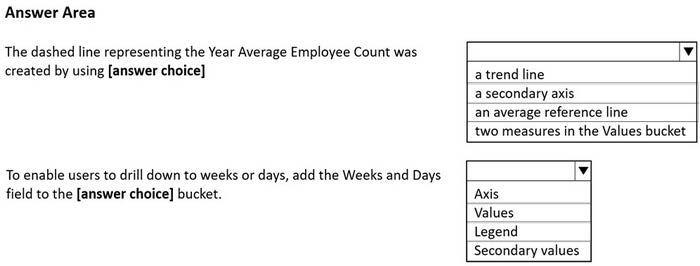
You are creating a line chart in a Power BI report as shown in the following exhibit.
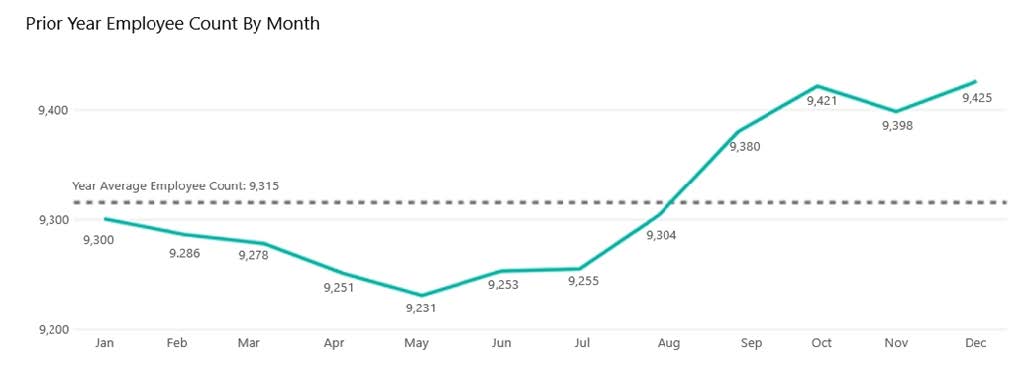
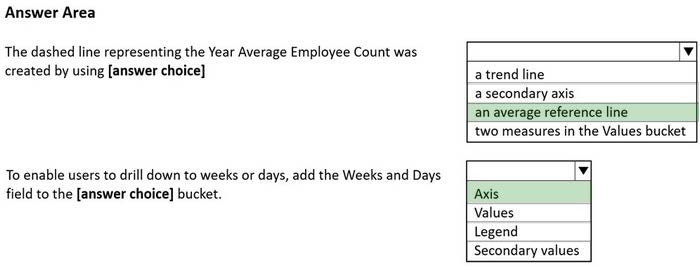
Use the drop-down menus to select the answer choice that completes each statement based on the information presented in the graphic.
NOTE: Each correct selection is worth one point.
Hot Area:
-
Question 280:
HOTSPOT
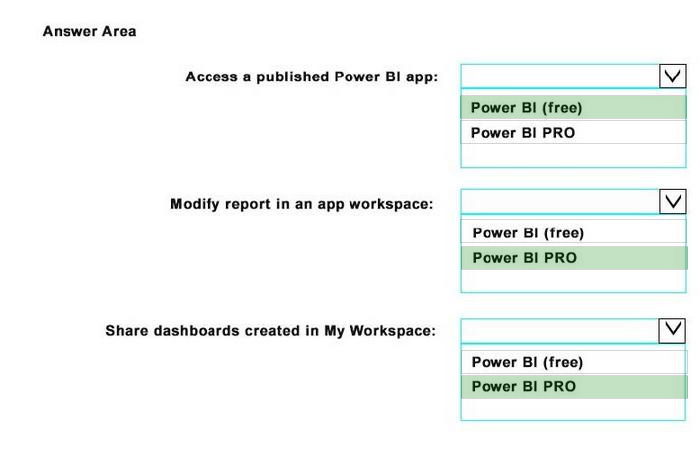
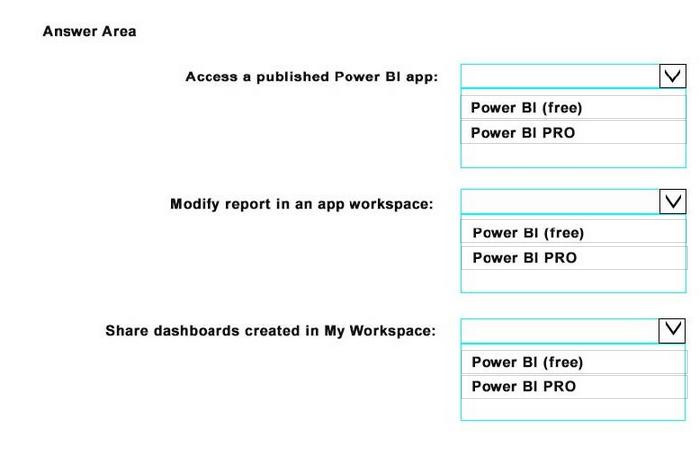
Your company plans to use Power BI for 20 users in the sales department. The users will perform the following tasks:
1.
Access a published Power BI app
2.
Modify reports in an app workspace
3.
Share dashboards created in My Workspace
You need to identify which Power BI licenses are required for the tasks. The solution must use the Power BI (free) licenses, whenever possible.
Which license should you identify for each task? To answer, select the appropriate options in the answer area.
NOTE: Each correct selection is worth one point.
Hot Area:
Related Exams:
62-193
Technology Literacy for Educators70-243
Administering and Deploying System Center 2012 Configuration Manager70-355
Universal Windows Platform – App Data, Services, and Coding Patterns77-420
Excel 201377-427
Excel 2013 Expert Part One77-725
Word 2016 Core Document Creation, Collaboration and Communication77-726
Word 2016 Expert Creating Documents for Effective Communication77-727
Excel 2016 Core Data Analysis, Manipulation, and Presentation77-728
Excel 2016 Expert: Interpreting Data for Insights77-731
Outlook 2016 Core Communication, Collaboration and Email Skills
Tips on How to Prepare for the Exams
Nowadays, the certification exams become more and more important and required by more and more enterprises when applying for a job. But how to prepare for the exam effectively? How to prepare for the exam in a short time with less efforts? How to get a ideal result and how to find the most reliable resources? Here on Vcedump.com, you will find all the answers. Vcedump.com provide not only Microsoft exam questions, answers and explanations but also complete assistance on your exam preparation and certification application. If you are confused on your PL-300 exam preparations and Microsoft certification application, do not hesitate to visit our Vcedump.com to find your solutions here.
