What do the colours Blue and Green represent in Tableau?
A. Discrete and Continuous
B. Measures and Dimensions
C. Continuous and Discrete
D. Dimensions and Measures
Correct Answer: A
Important question! If you selected Dimension and Measure, don't worry! It is a very common mistake. But we're here to learn aren't we?
When you connect to a new data source, Tableau assigns each field in the data source as dimension or measure in the Data pane, depending on the type of data the field contains. You use these fields to build views of your data.
How does Tableau know at which level to aggregate values?
A. Values are always aggregated at the level of granularity of the worksheet.
B. Tableau doesn't aggregate values, we do!
C. Values are always aggregated at the level of the Date Part
D. Aggregation is always done by using Tableau special formulas
Correct Answer: A
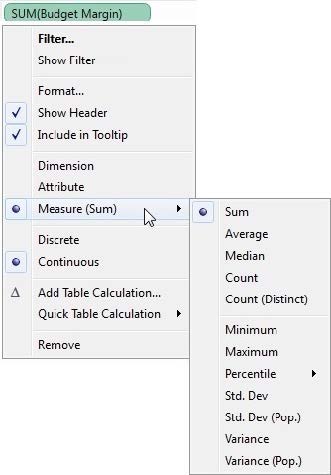
In Tableau, you can aggregate measures or dimensions, though it is more common to aggregate measures. Whenever you add a measure to your view, an aggregation is applied to that measure by default. The type of aggregation applied varies depending on the context of the view.
When you add a measure to the view, Tableau automatically aggregates its values. Sum, average, and median are common aggregations; for a complete list, see List of Predefined Aggregations in Tableau. The current aggregation appears as part of the measure's name in the view. For example, Sales becomes SUM(Sales). Every measure has a default aggregation which is set by Tableau when you connect to a data source. You can view or change the default aggregation for a measure--see Set the Default Aggregation for a Measure.
You can change the aggregation for a measure in the view from its context menu:
True or False: Context Filters are executed after Data Source filters
A. True
B. False
Correct Answer: A
THIS IS A VERY IMPORTANT
Question 105:
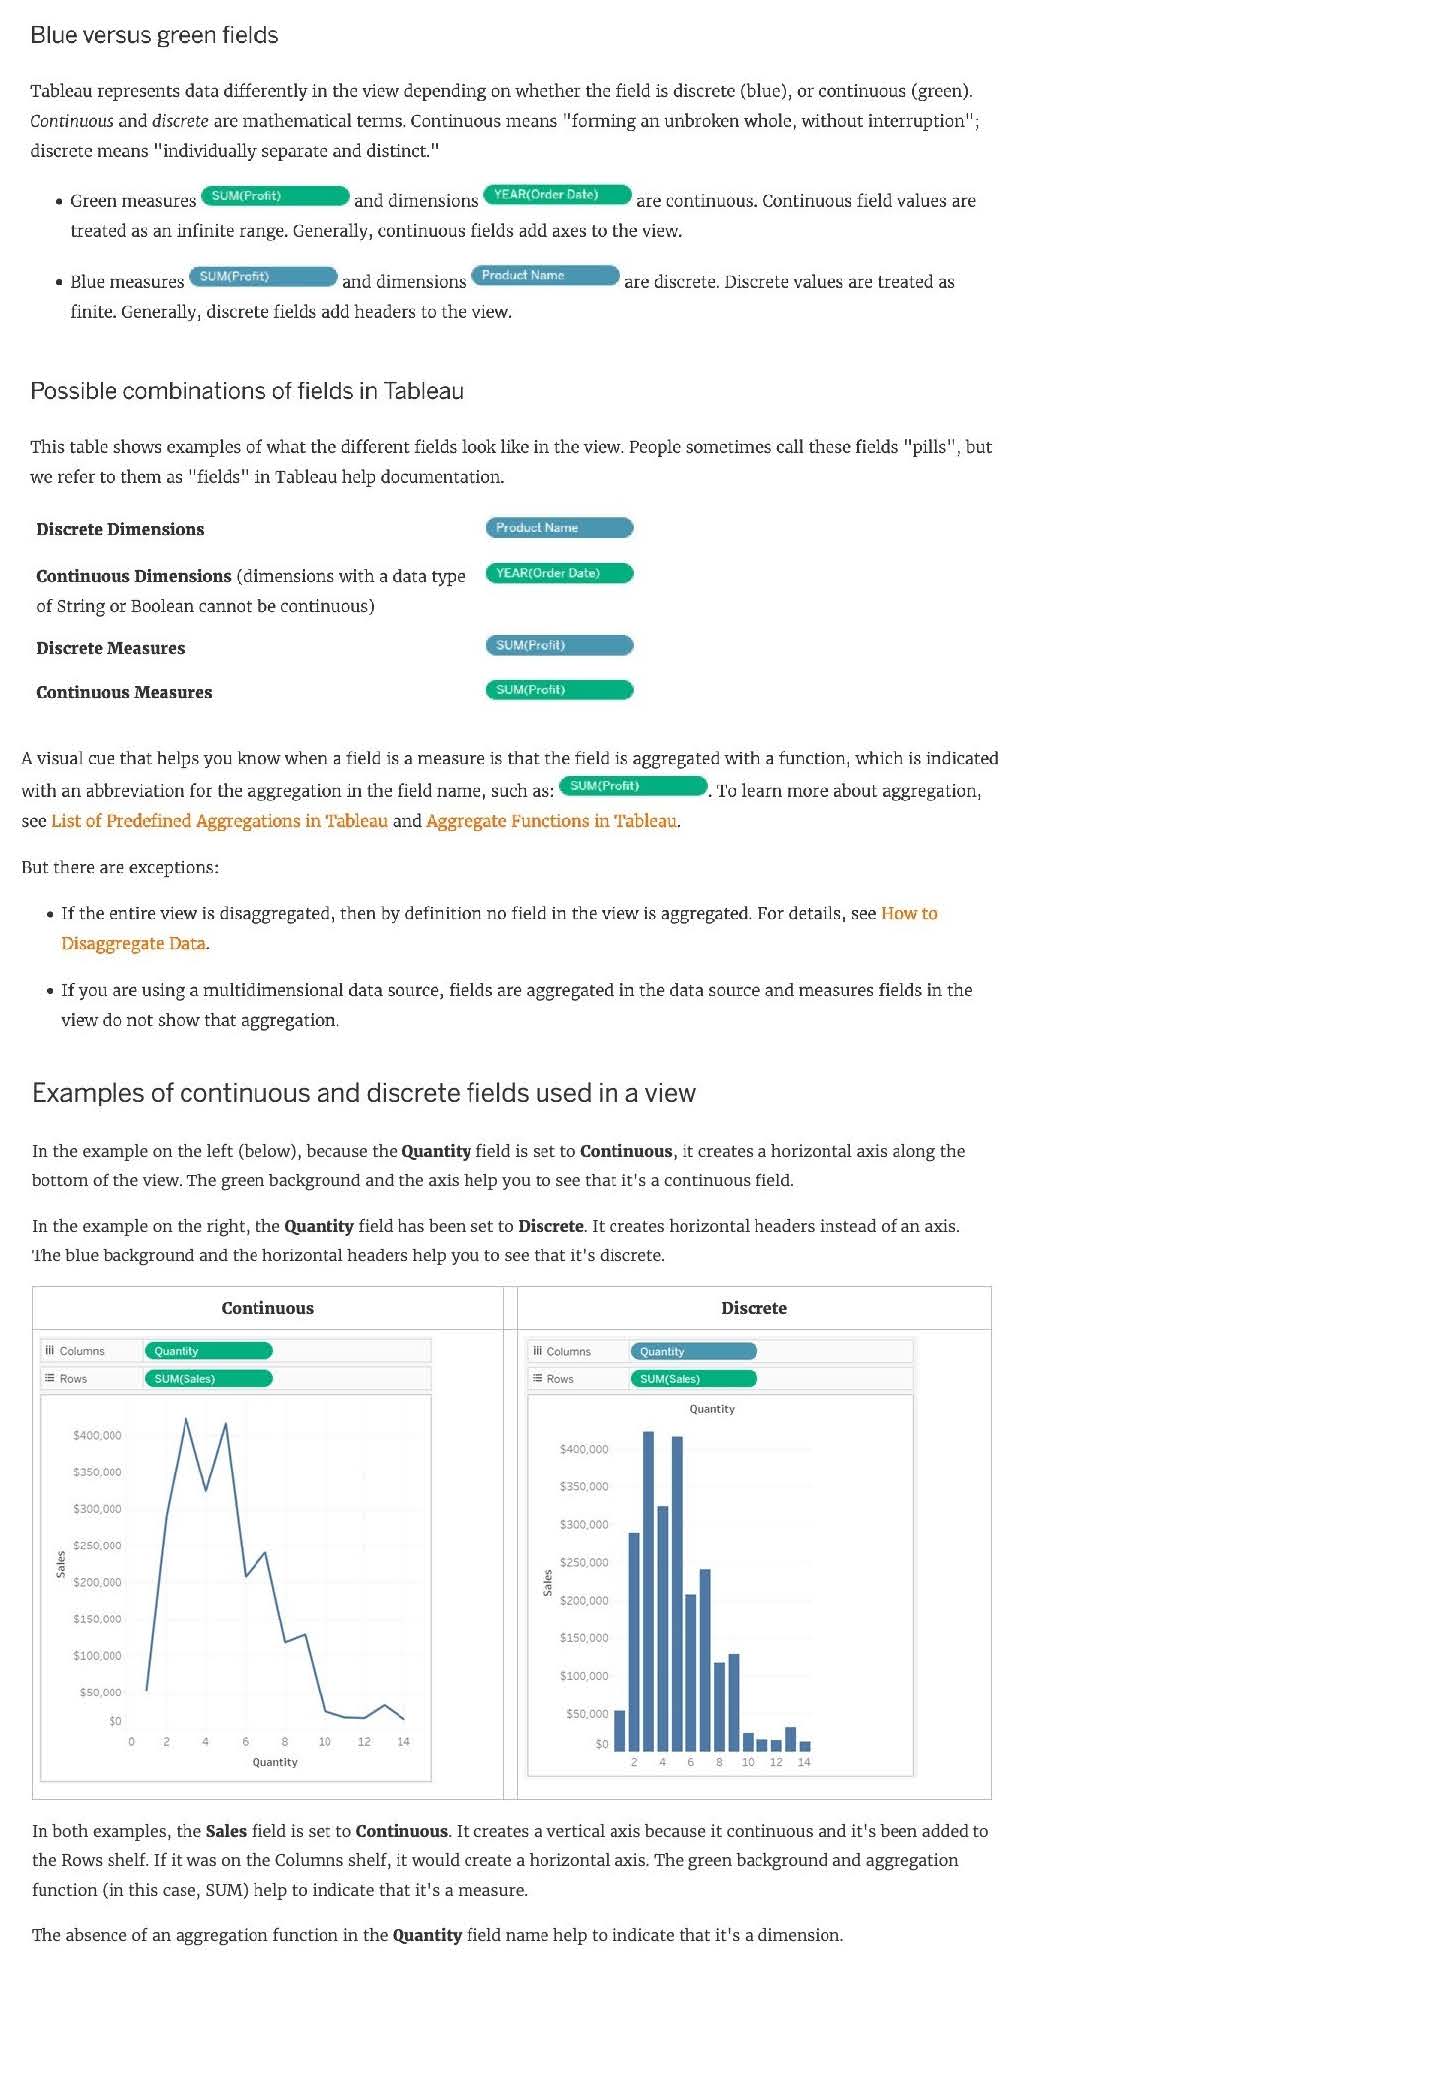
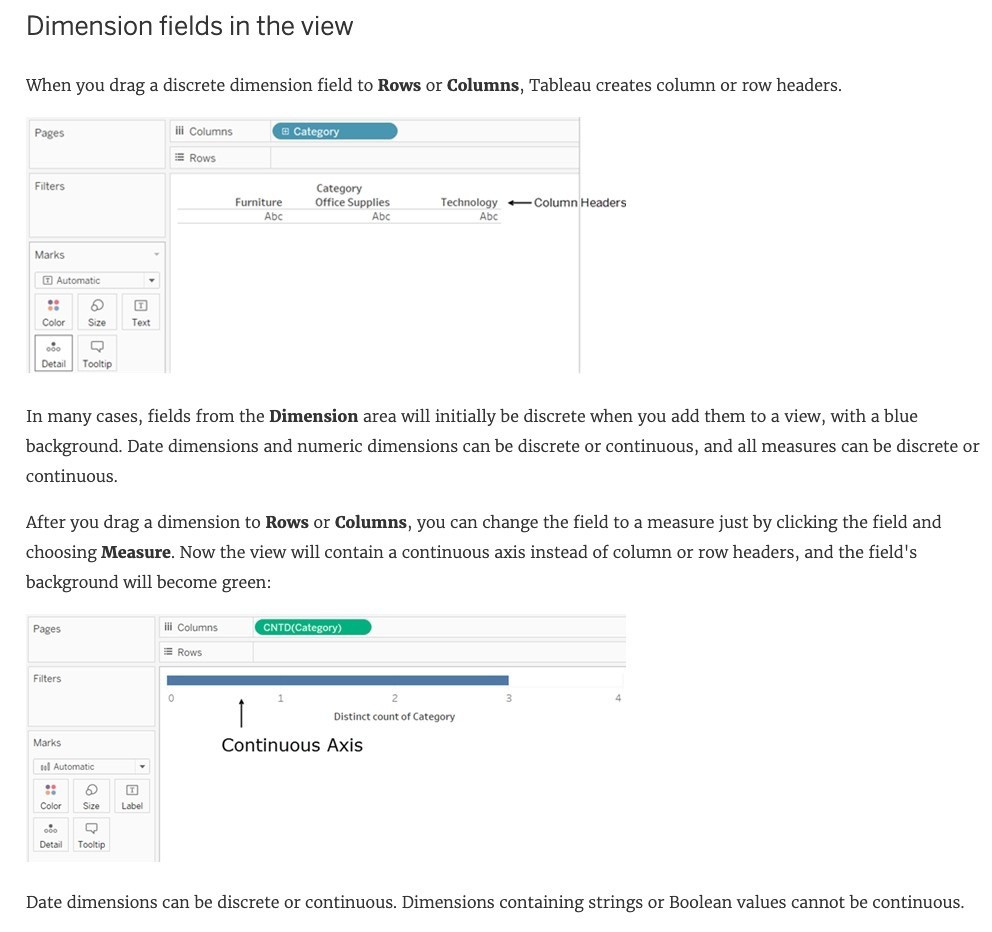
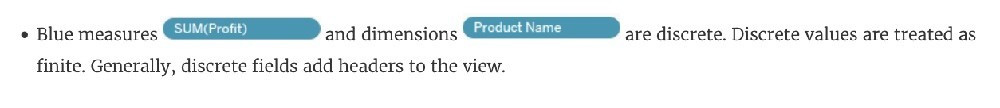
What does it imply if a field has a blue background?
A. It is continuous
B. It is discrete
C. It is a dimension
D. It is a measure
Correct Answer: B
When you connect to a new data source, Tableau assigns each field in the data source as dimension or measure in the Data pane, depending on the type of data the field contains. You use these fields to build views of your data.
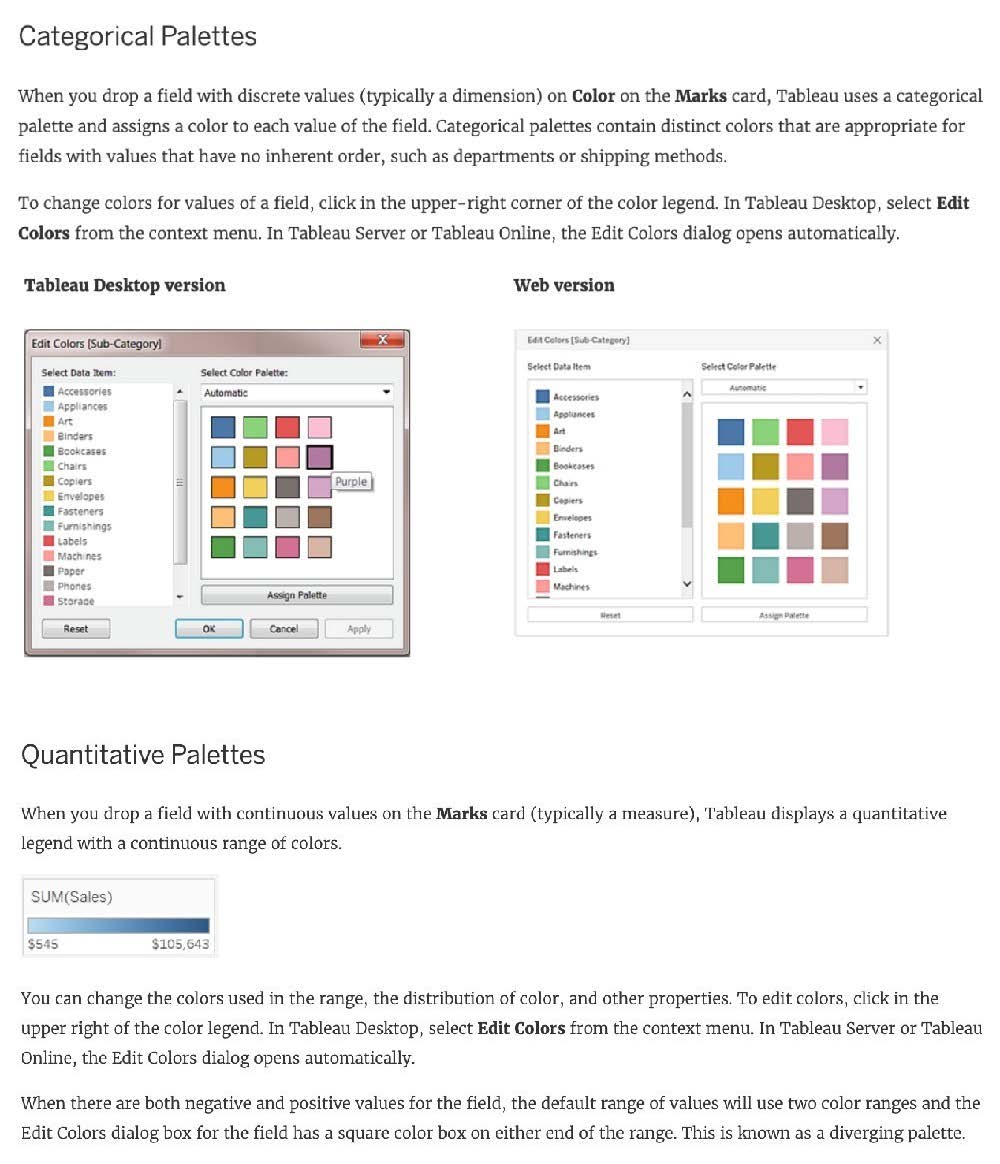
Dragging a ______________ to colour creates distinct colours for each item whereas dragging a ______________ to colour creates a gradient
A. Discrete value, Continuous Value
B. Geographic Value, Discrete Value
C. Continuous Value, Discrete Value
D. Longitude, Latitude
Correct Answer: A
Remember that dragging a discrete value to colour creates distinct colours for each item whereas dragging a continuous value to colour creates a gradient. ( Same for Map ) From the official documentation:
Which of the following would you use to connect to multiple tables in a single data source at once?
A. A Blend
B. A Hierarchy
C. A Set
D. A Join
Correct Answer: D
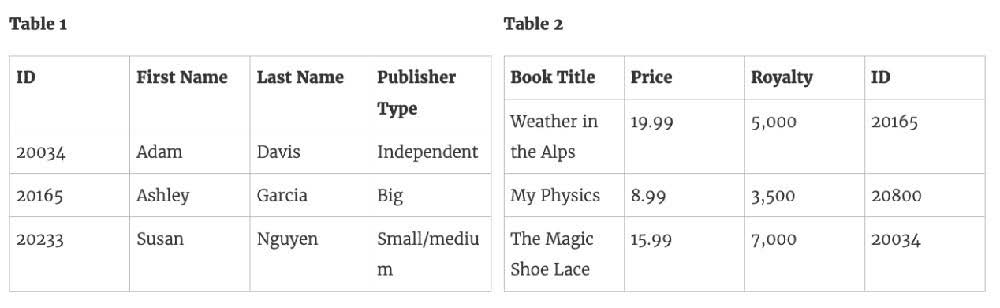
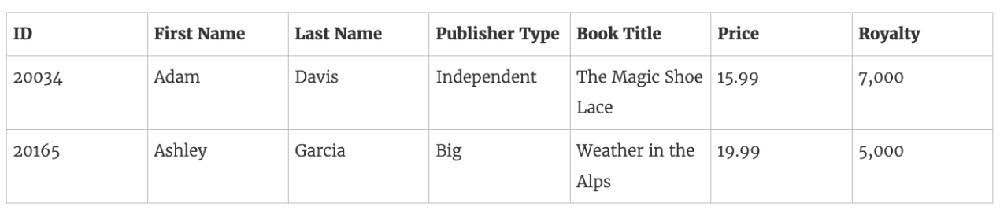
The data that you analyze in Tableau is often made up of a collection of tables that are related by specific fields (that is, columns). Joining is a method for combining data on based on those common fields. The result of combining data using a join is a virtual table that is typically extended horizontally by adding columns of data. For example, consider the following two tables originating from a single data source:
We can combine these 2 tables, simply by joining the tables on ID to answer questions like, "How much was paid in royalties for authors from a given publisher?". By combining tables using a join, you can view and use related data from different tables in your analysis.
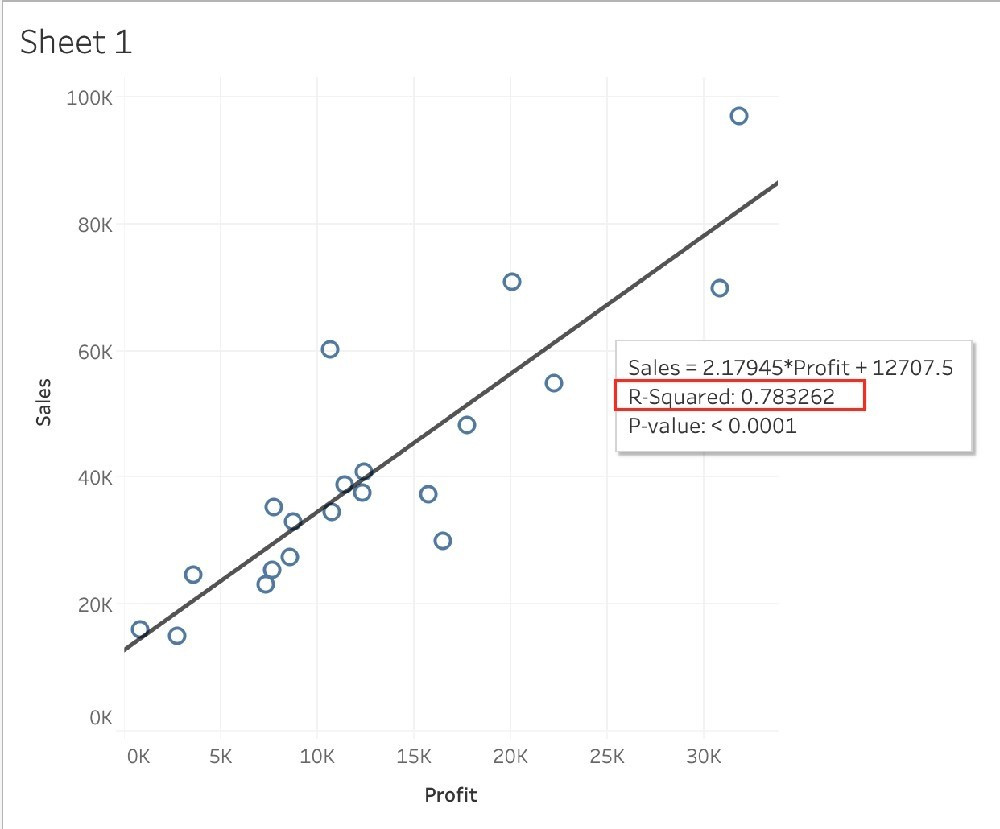
Using the CoffeeChain table, create a scatter plot of Profit (x-axis) vs Sales (y-axis) broken down by State. Add a Linear trend line to the view. What is its R-squared value?
A. 0.783262
B. 0.739284
C. 0.759329
D. 0.748472
Correct Answer: A
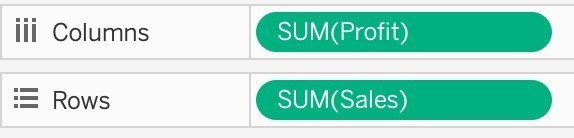
Trend lines have become popular questions in recent Tableau examinations. Follow along: 1) First drag Sales to the Rows shelf and Profit to the Columns shelf:
You will only see a single mark since the view is aggregated.
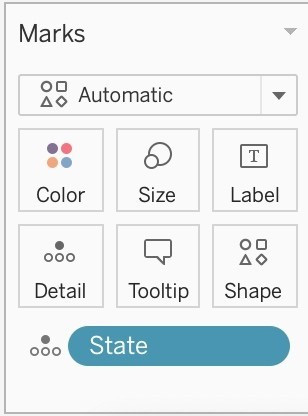
2) Now, break down this view by state. Drag State into Detail on the Marks shelf ( or directly to the view):
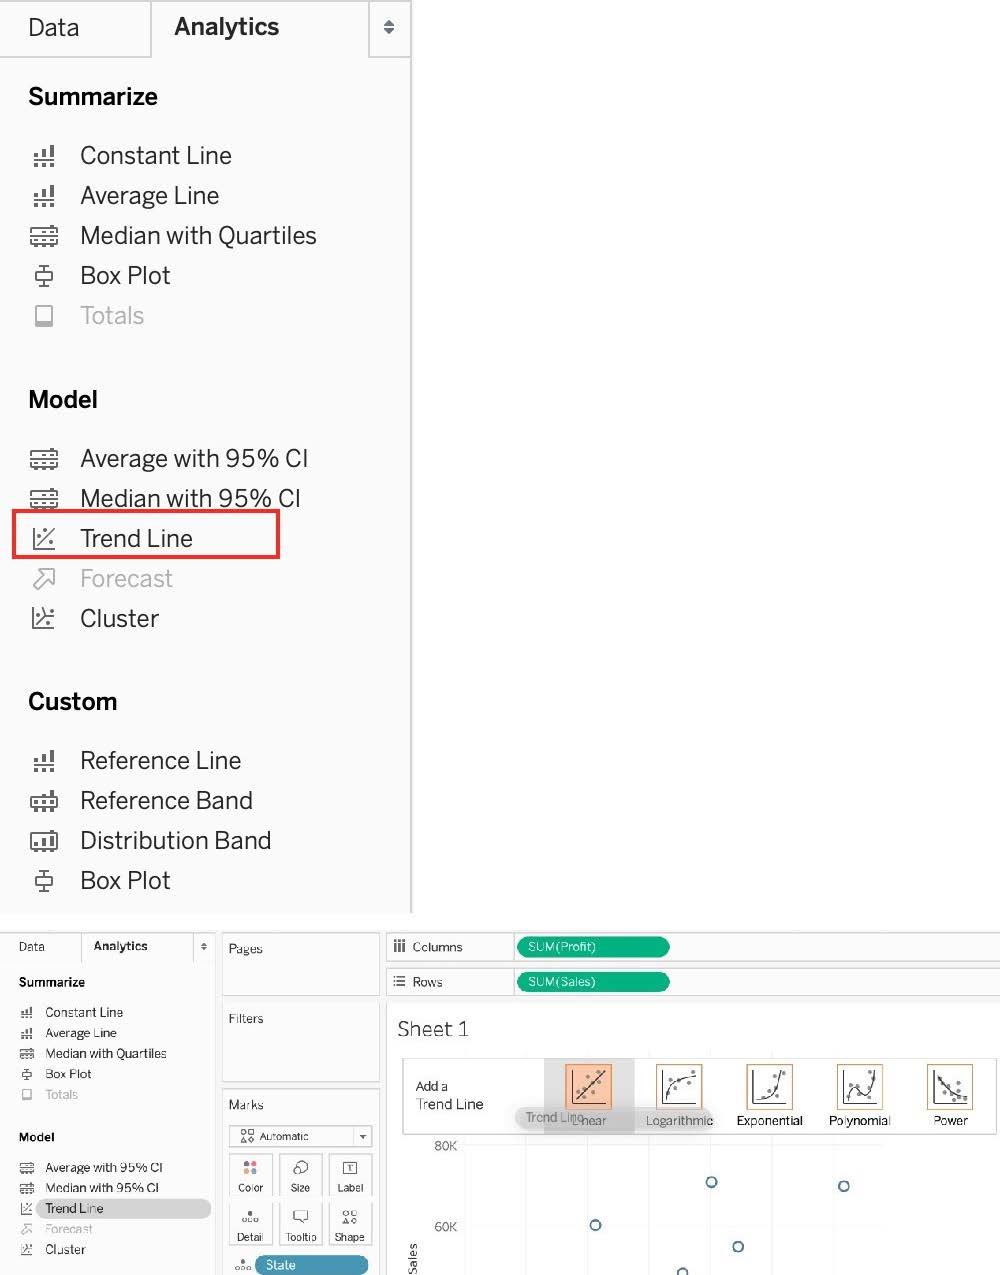
3) Finally, move to the Analytics pane, and drag Trend line to the view. When you drag it, select the Linear option!:
4) The following is our view. Hover over the trend line to see the R-squared value:
Question 109:
True or False: Enabling any other type of sort (Field, alphabetic, or Nested) clears the manual sort we create.
A. True
B. False
Correct Answer: A
This is true. a Manual Sort lets you select a value and move it to the desired position, either by dragging it in the list or using the arrows to the right. However, as soon as you choose some other type of sort-be it field, nested, or alphabetic, our custom created manual sort gets deleted/cleared. Reference: https://help.tableau.com/current/pro/desktop/en-us/sortgroup_sorting_computed_howto.htm
Question 110:
True or False: We can disaggregate the data, to see all of the marks in the view at the most detailed level of granularity
A. True
B. False
Correct Answer: A
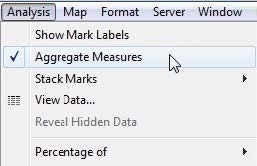
Whenever you add a measure to your view, an aggregation is applied to that measure by default. This default is controlled by the Aggregate Measures setting in the Analysis menu. If you decide you want to see all of the marks in the view at
the most detailed level of granularity, you can disaggregate the view. Disaggregating your data means that Tableau will display a separate mark for every data value in every row of your data source.
To disaggregate all measures in the view:
Clear the Analysis >Aggregate Measures option. If it is already selected, click Aggregate Measures once to deselect it.
Nowadays, the certification exams become more and more important and required by more and more enterprises when applying for a job. But how to prepare for the exam effectively? How to prepare for the exam in a short time with less efforts? How to get a ideal result and how to find the most reliable resources? Here on Vcedump.com, you will find all the answers. Vcedump.com provide not only Tableau exam questions, answers and explanations but also complete assistance on your exam preparation and certification application. If you are confused on your TDS-C01 exam preparations and Tableau certification application, do not hesitate to visit our Vcedump.com to find your solutions here.