Exam Details
Exam Code
:TDS-C01Exam Name
:Tableau Certified Desktop SpecialistCertification
:Tableau CertificationsVendor
:TableauTotal Questions
:341 Q&AsLast Updated
:Apr 16, 2025
Tableau Tableau Certifications TDS-C01 Questions & Answers
-
Question 181:
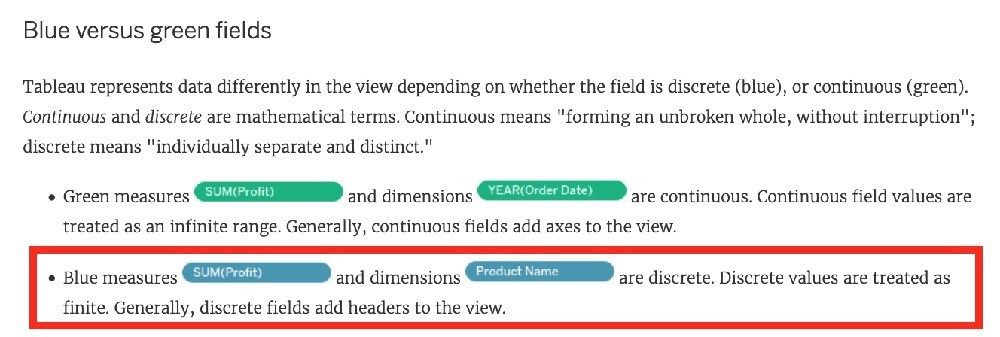
If you see a Blue field, generally it will add _____________ to the view
A. axis
B. both
C. none
D. headers
-
Question 182:
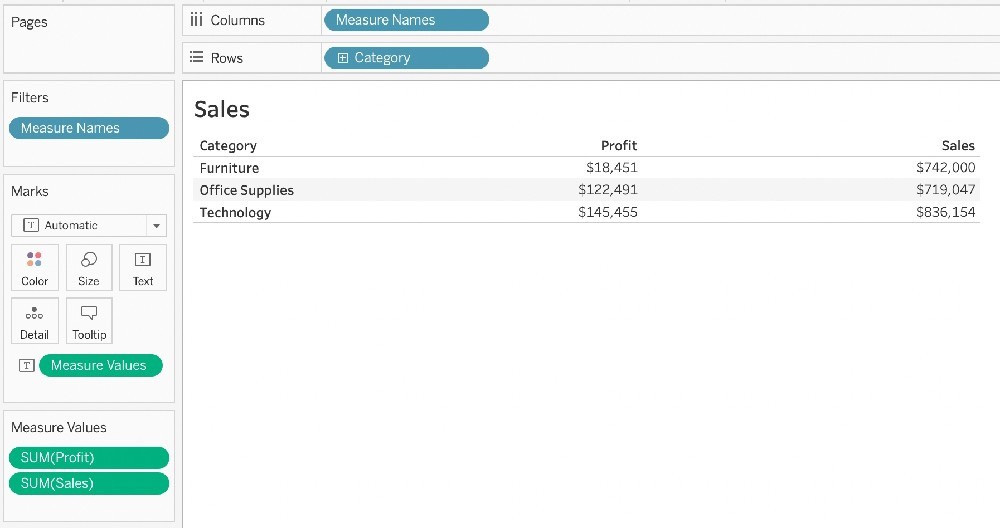
Which of the following are True for Measure Names?
A. It contains all the measures in your data, collected into a single field with continuous values.
B. When you add it to a view, all of the measure names appear as row or column headers in the view.
C. When working with a text table showing Profit for each Category, when you add Sales to the text table (by dragging it and dropping it in the view), the measure names field is automatically dragged to the row and filter shelves.
D. It contains the names of all measures in your data, collected into a single field with discrete values.
-
Question 183:
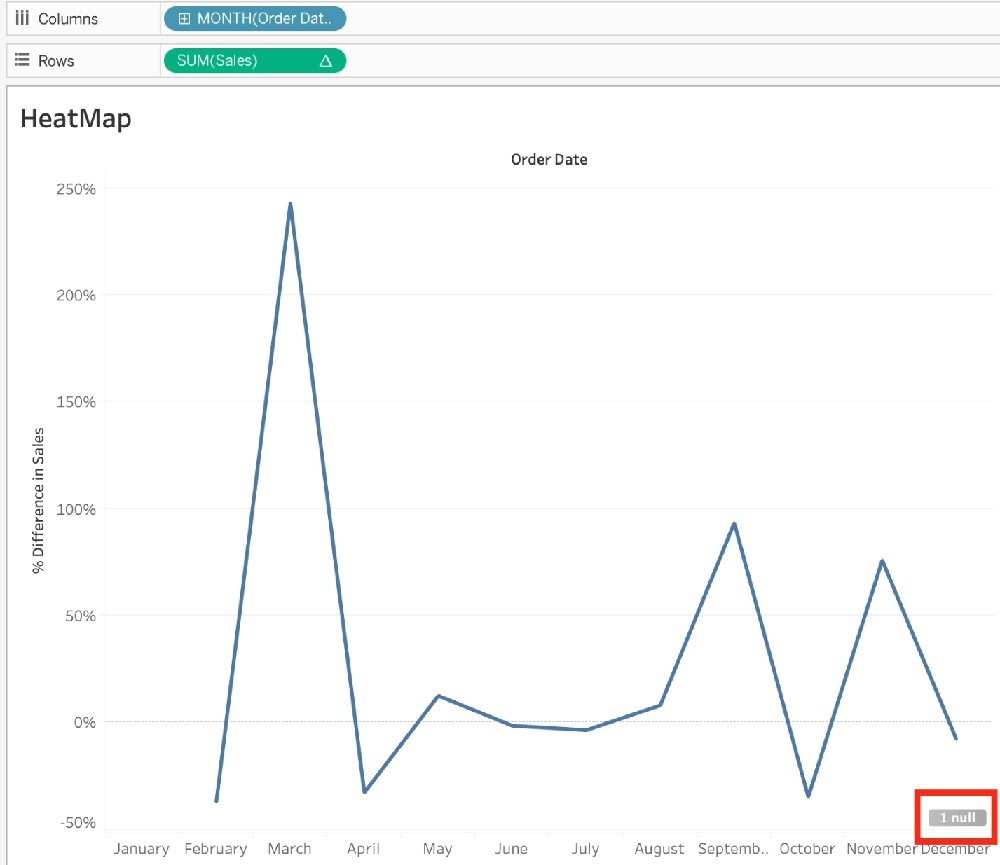
If you use a percent difference Quick Table Calculation, what value will be the first data value?
A. null
B. -1
C. 0000
D. 0
-
Question 184:
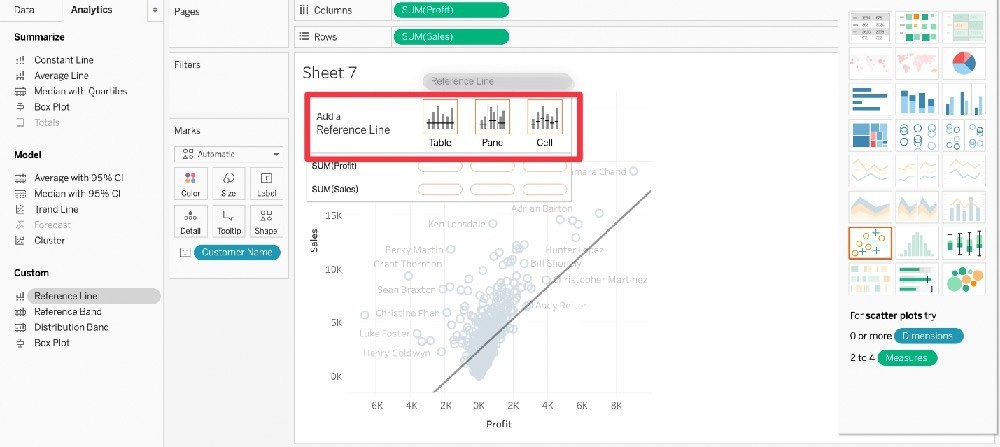
Which of the following are valid options to define the scope of a reference line? Choose 3.
A. Pane
B. Table
C. Section
D. Window
E. cell
F. Axis
-
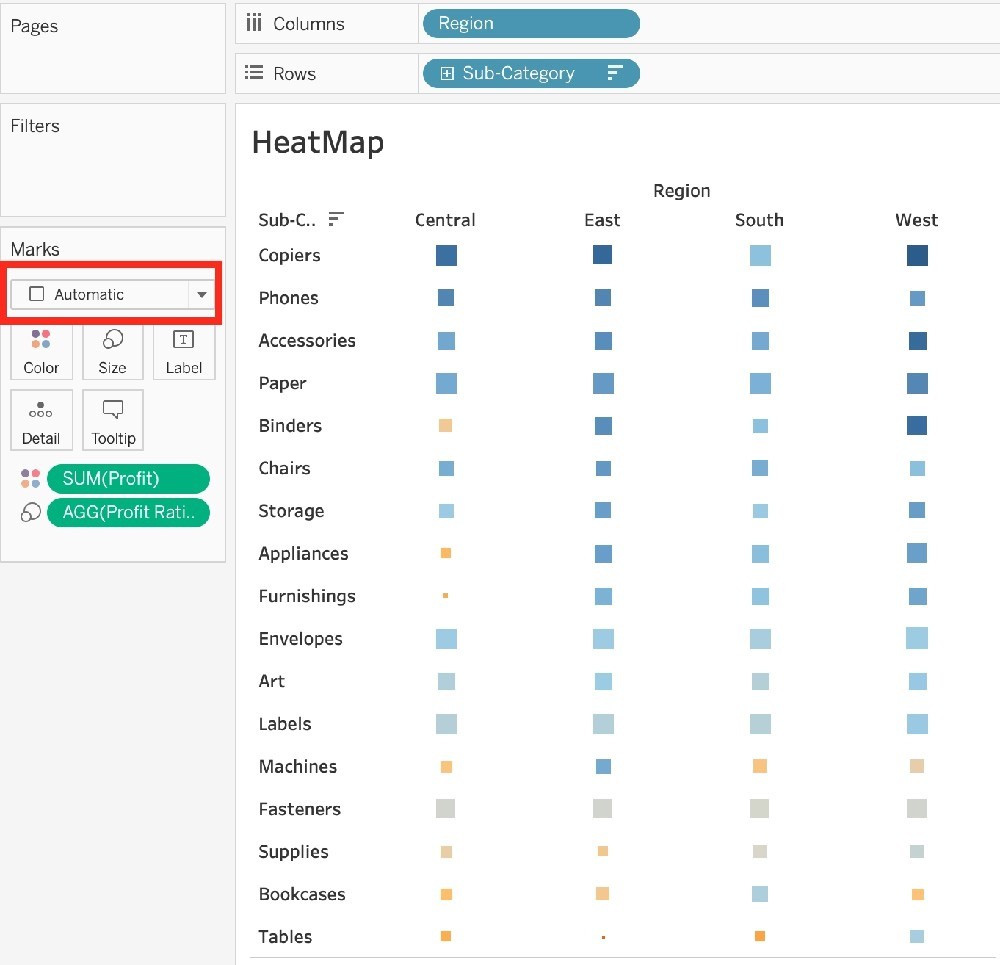
Question 185:
Which of the following shapes does a Heat Map use by default?
A. Square
B. Line
C. Text
D. Circle
-
Question 186:
True or False: Trend lines can only be used with numeric or date fields
A. True
B. False
-
Question 187:
Given a map, which of the following fields can be placed in Size,Shape,Detail,Color
A. Profit, State, Number of Records, Sales
B. Region, Country, Profit, State
C. Longitude, Country, State, Sales
D. Sales, State, Country, Profit
-
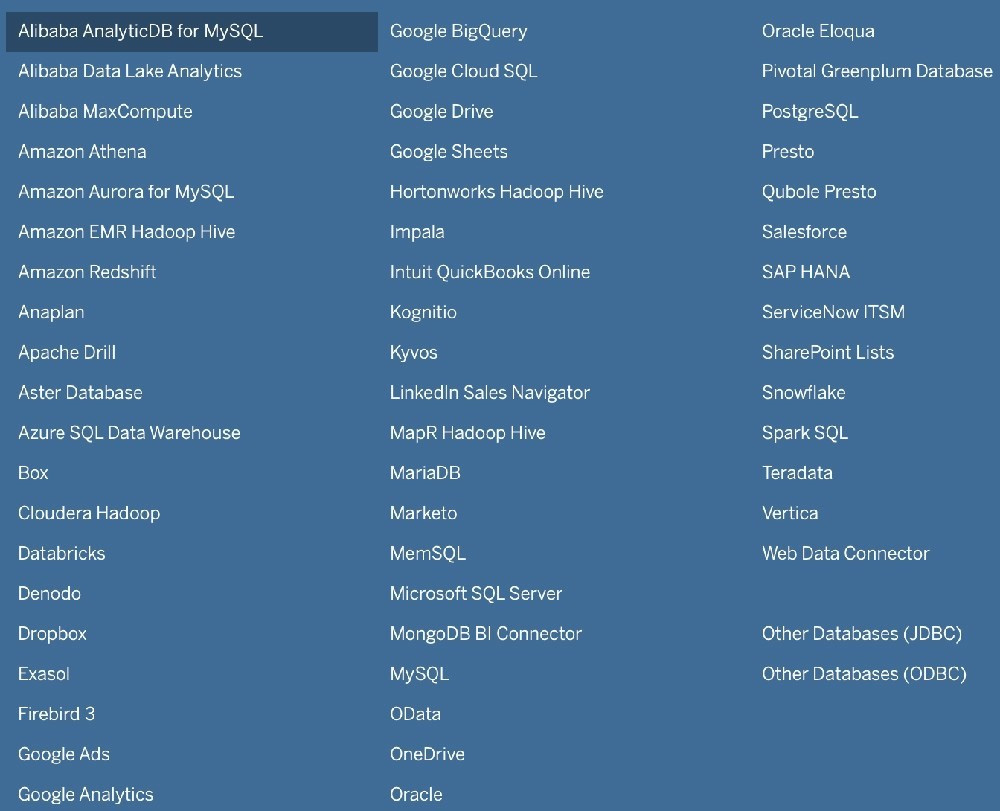
Question 188:
Which of the following is NOT a valid official data source in Tableau Desktop?
A. PostgreSQL
B. SAP HANA
C. Google Firebase
D. Amazon Redshift
-
Question 189:
Which of the following are FALSE about Joins?
A. Joins can be defined at the time of query dynamically
B. May drop unmatched measure values
C. They are displayed with Venn diagram icons between physical tables
D. Joined tables are never merged into a single table.
E. They are a more dynamic way than relationships to combine data
-
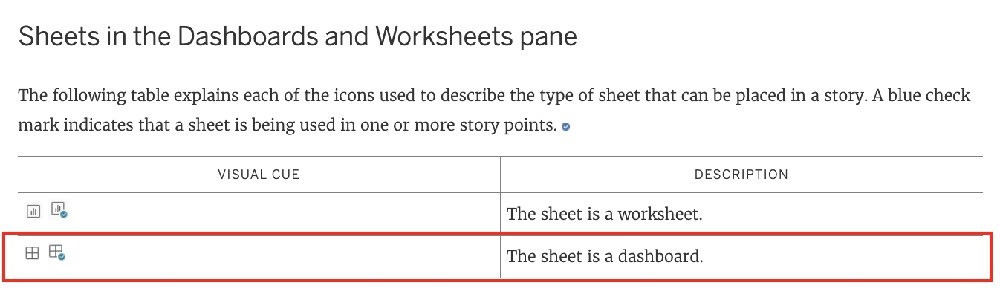
Question 190:
What does the following icon do in Tableau? Larger image
A. Create a Story
B. Create a Story and Dashboard both
C. Create a Worksheet
D. Create a Dashboard
Tips on How to Prepare for the Exams
Nowadays, the certification exams become more and more important and required by more and more enterprises when applying for a job. But how to prepare for the exam effectively? How to prepare for the exam in a short time with less efforts? How to get a ideal result and how to find the most reliable resources? Here on Vcedump.com, you will find all the answers. Vcedump.com provide not only Tableau exam questions, answers and explanations but also complete assistance on your exam preparation and certification application. If you are confused on your TDS-C01 exam preparations and Tableau certification application, do not hesitate to visit our Vcedump.com to find your solutions here.