Exam Details
Exam Code
:TDS-C01Exam Name
:Tableau Certified Desktop SpecialistCertification
:Tableau CertificationsVendor
:TableauTotal Questions
:341 Q&AsLast Updated
:Apr 16, 2025
Tableau Tableau Certifications TDS-C01 Questions & Answers
-
Question 191:
_____________ contains the visualisations, info needed to build the visualisations, and a copy of the data source.
A. Tableau Data Extract (.tde)
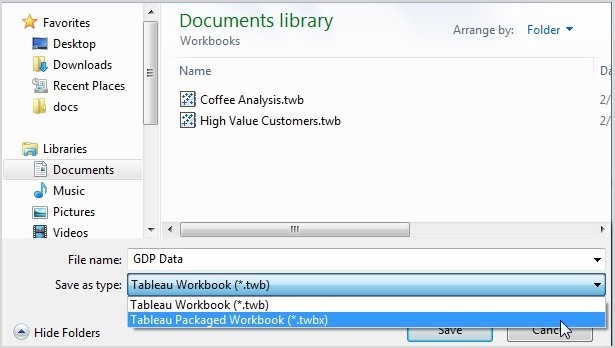
B. Tableau Packaged Workbook (.twbx)
C. Tableau Bookmark (.tbm)
D. Tableau Workbook (.twb)
-
Question 192:
A ________________ is a single zip file that contains a workbook along with any supporting local file data and background images. This format is the best way to package your work for sharing with others who don't have access to the original data.
A. .twbx file
B. .tbm file
C. .twb file
D. .tde file
-
Question 193:
For which of the following charts, does the Size option on the Marks card not work?
A. Gantt Chart
B. Bar Chart
C. Tree Map
D. Pie Chart
-
Question 194:
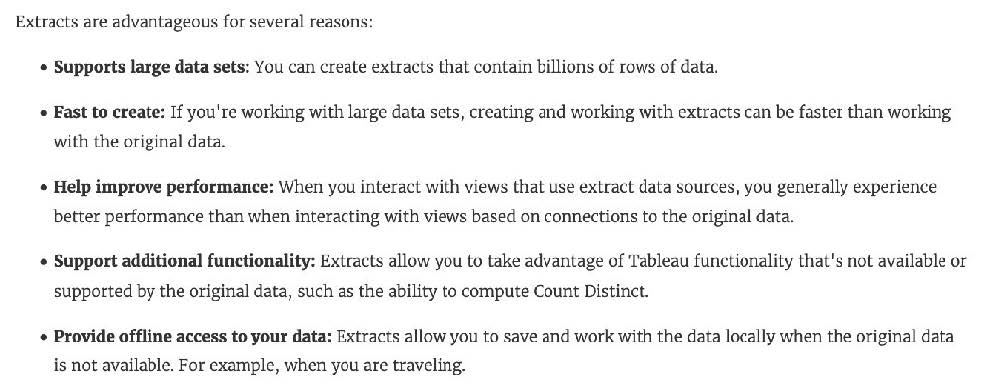
Which of the following are valid reasons to use a Tableau Data Extract (.tde) over Live Connections?
A. To support additional functionality such as count distinct
B. Fast to create
C. Help improve performance
D. To have access to the freshest possible data at all times
-
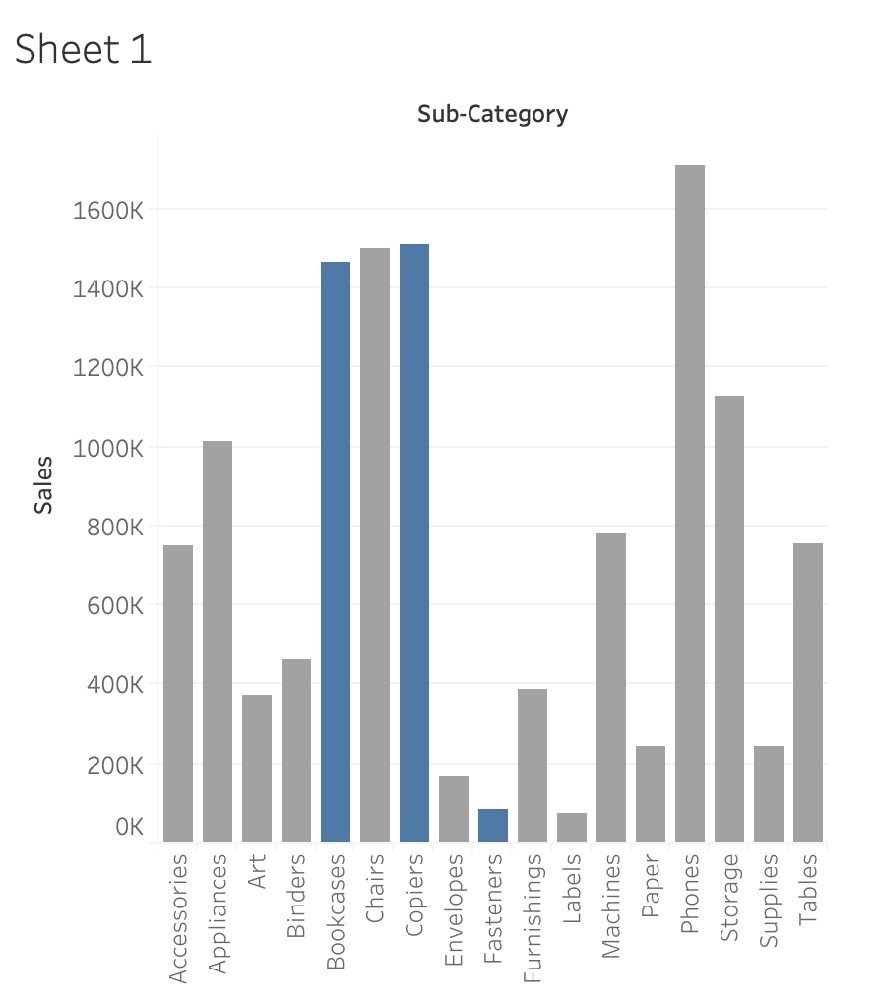
Question 195:
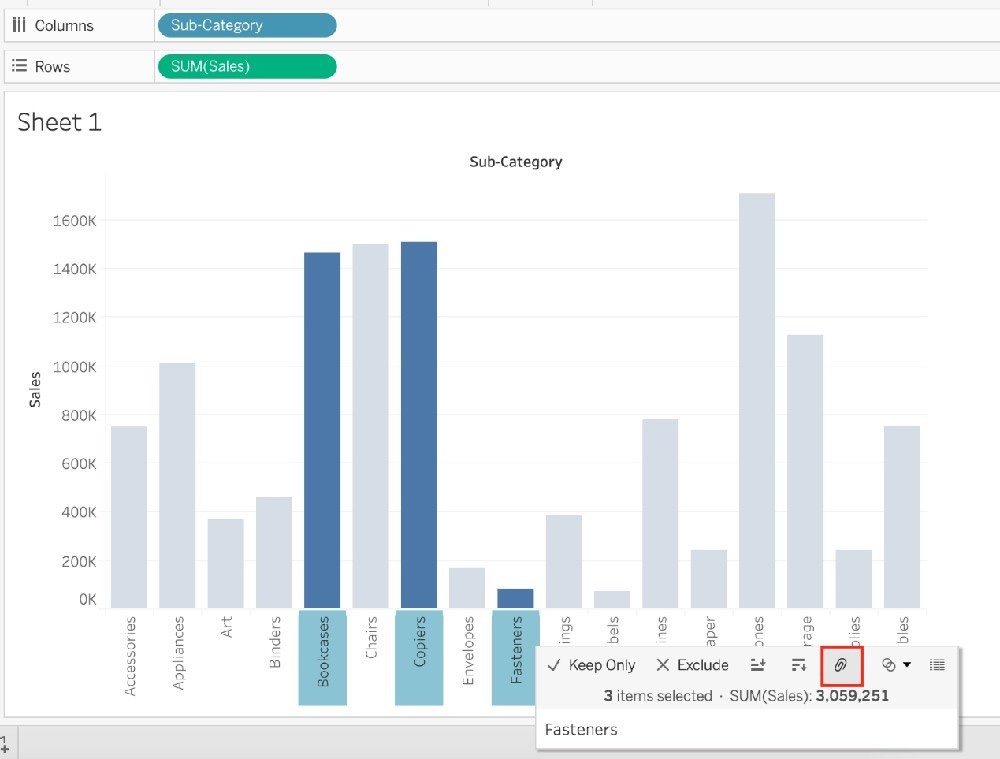
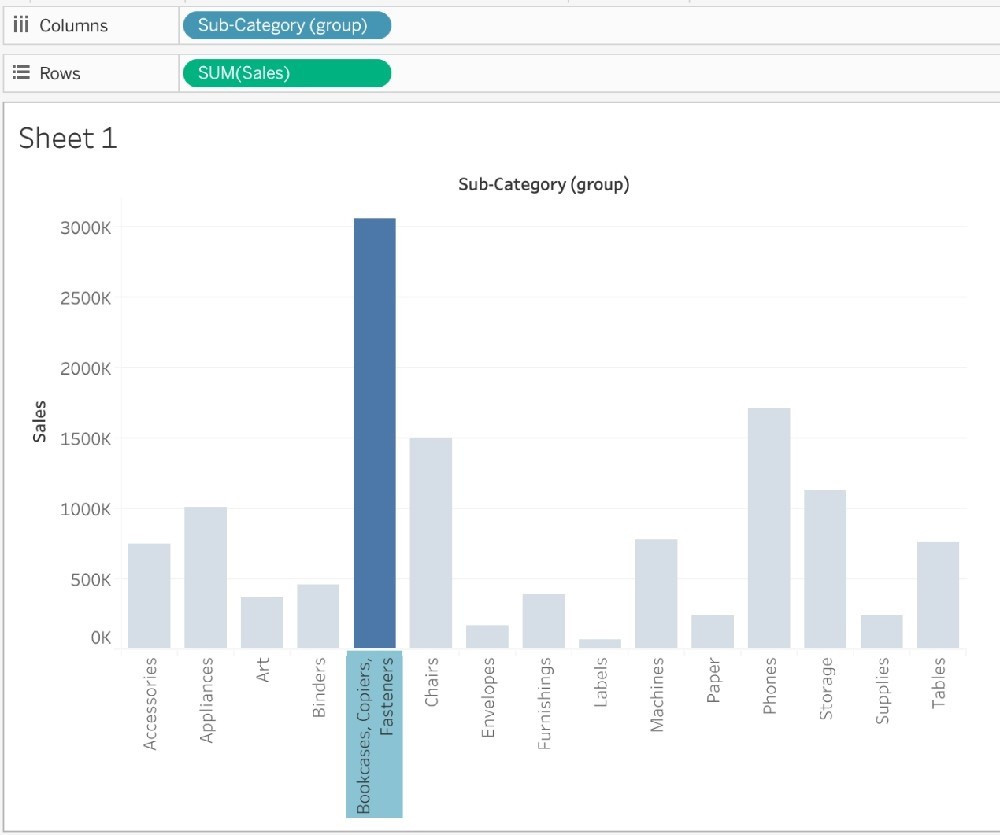
Suppose you have a bar chart. When we group by labels in a view, which of the following happens?
A. Nothing changes in the view, but a group is created in the Dimensions shelf.
B. The colours of the members selected are now the same, and different for the rest of the members.
C. Trick question! It is not possible to group by labels.
D. A new mark (bar) is created, which consolidates all members of the group.
-
Question 196:
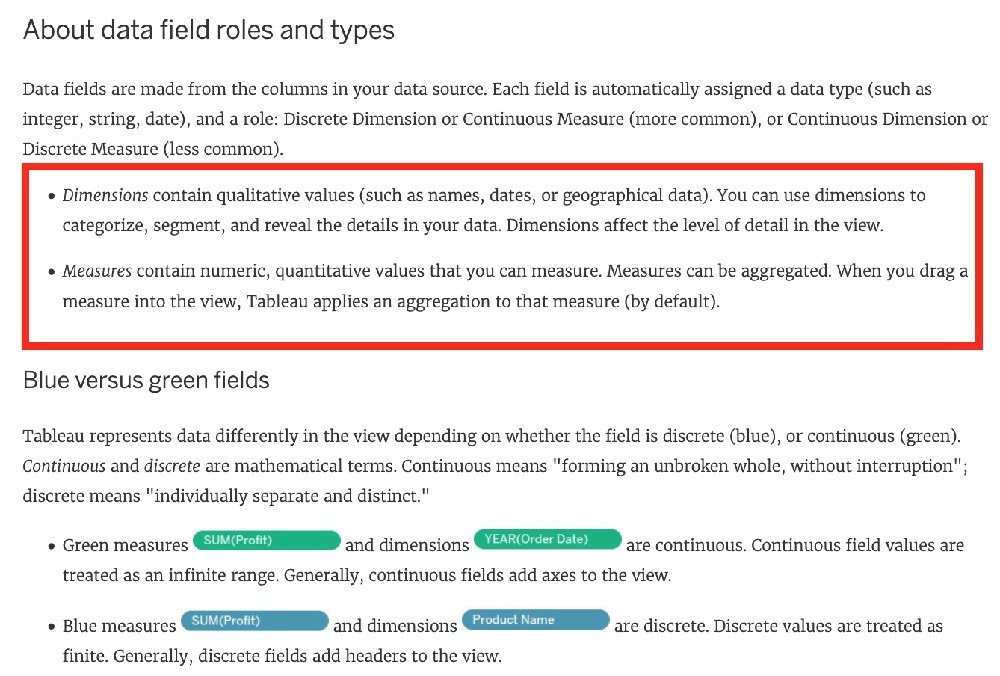
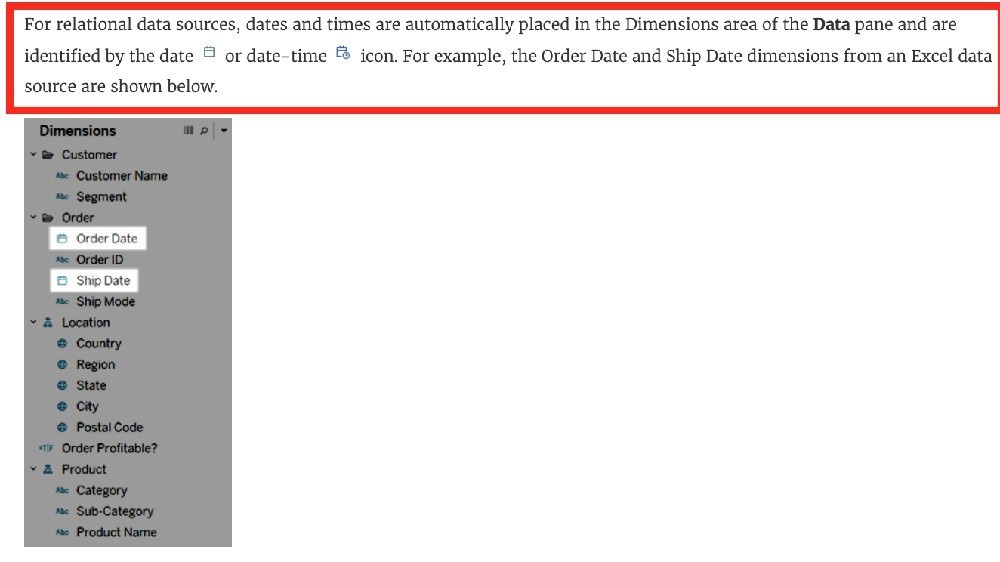
Which of the following are true about dimensions?
A. They contain contain numeric, quantitative values
B. They contain qualitative values (such as names, dates, or geographical data)
C. They affect the level of detail in the view
D. Dates are mostly placed in dimensions by default for relational data sources
-
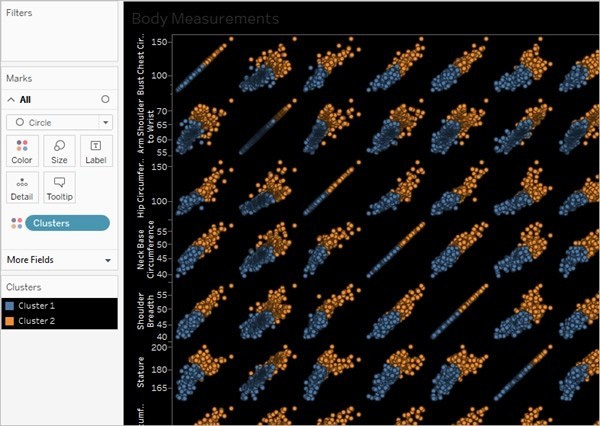
Question 197:
__________ is a technique in Tableau which will identify marks with similar characteristics
A. Clustering
B. Grouping
C. Sets
D. Union
-
Question 198:
Which of these is NOT a type of Quick Filter available in Tableau?
A. Wildcard Match
B. Multiple Values (dropdown)
C. Regex Match
D. Single Value (slider)
-
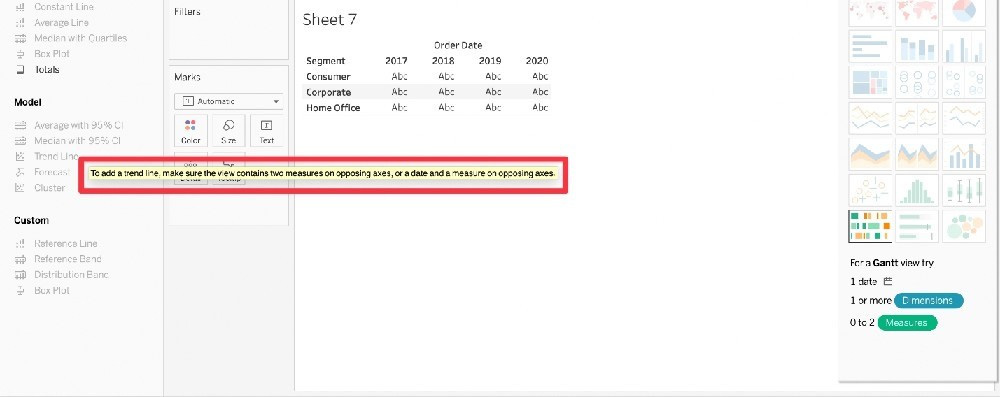
Question 199:
Which of the following are required to create a trend line?
A. 2 measures on opposing axes, or a date and a measure on opposing axes.
B. 1 measure, or a date and a dimension on opposing axes.
C. 1 measure only
D. 2 dimensions, or a date and a dimension on opposing axes.
-
Question 200:
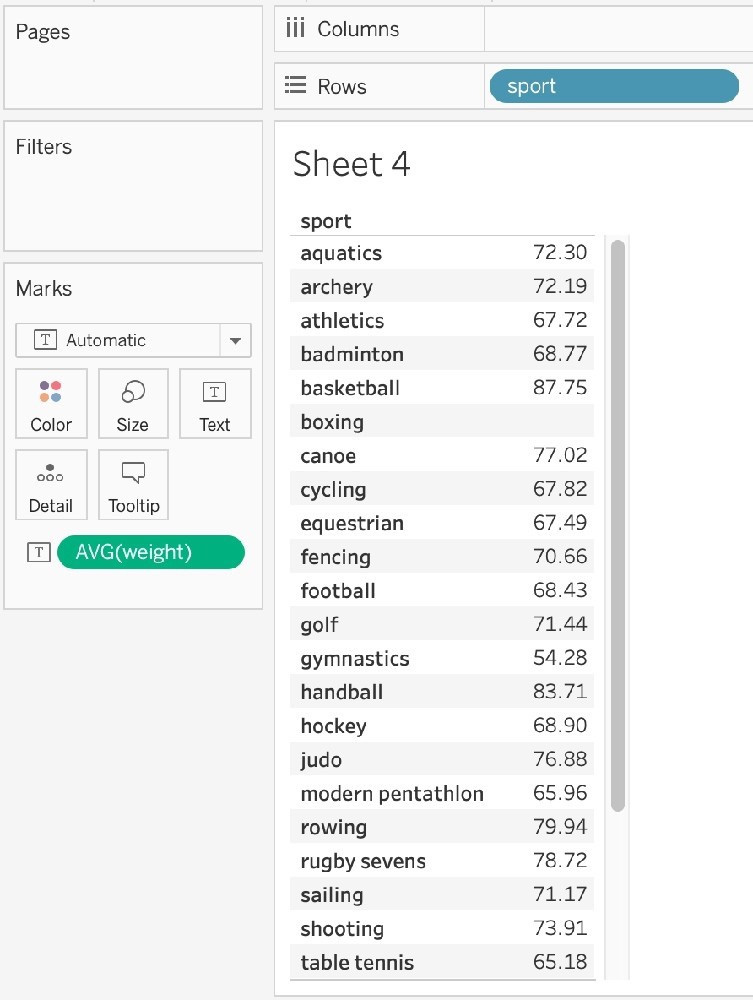
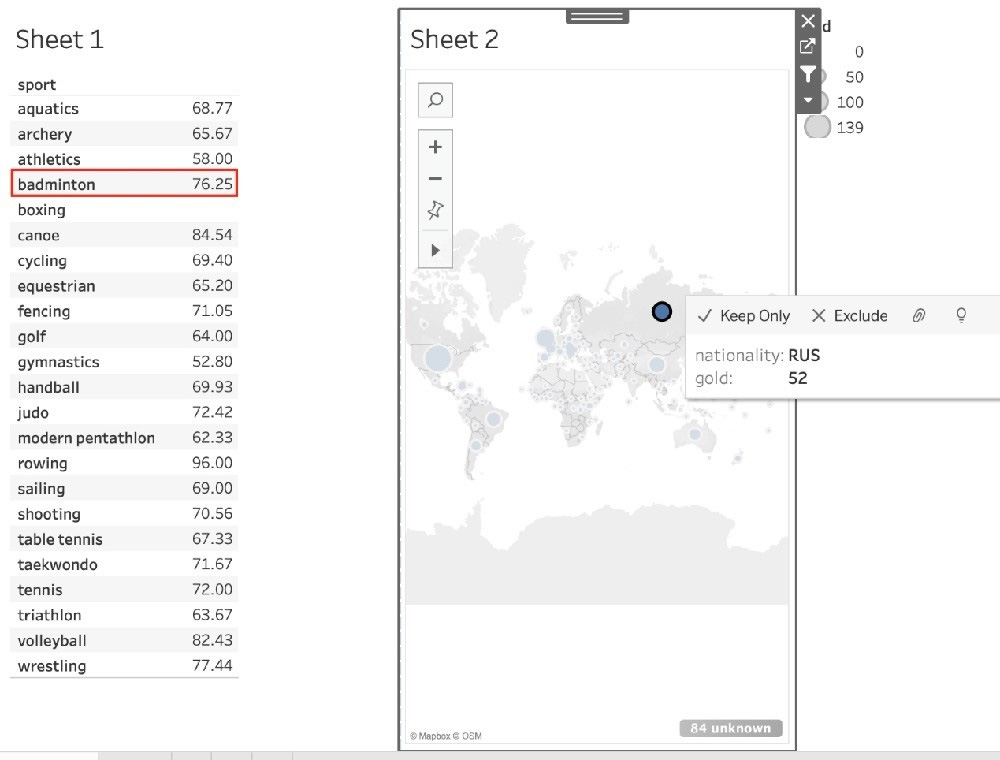
Using the atheletes table:
i) Create a sheet with a crosstab showing the Average weight for each sport (Sheet 1)
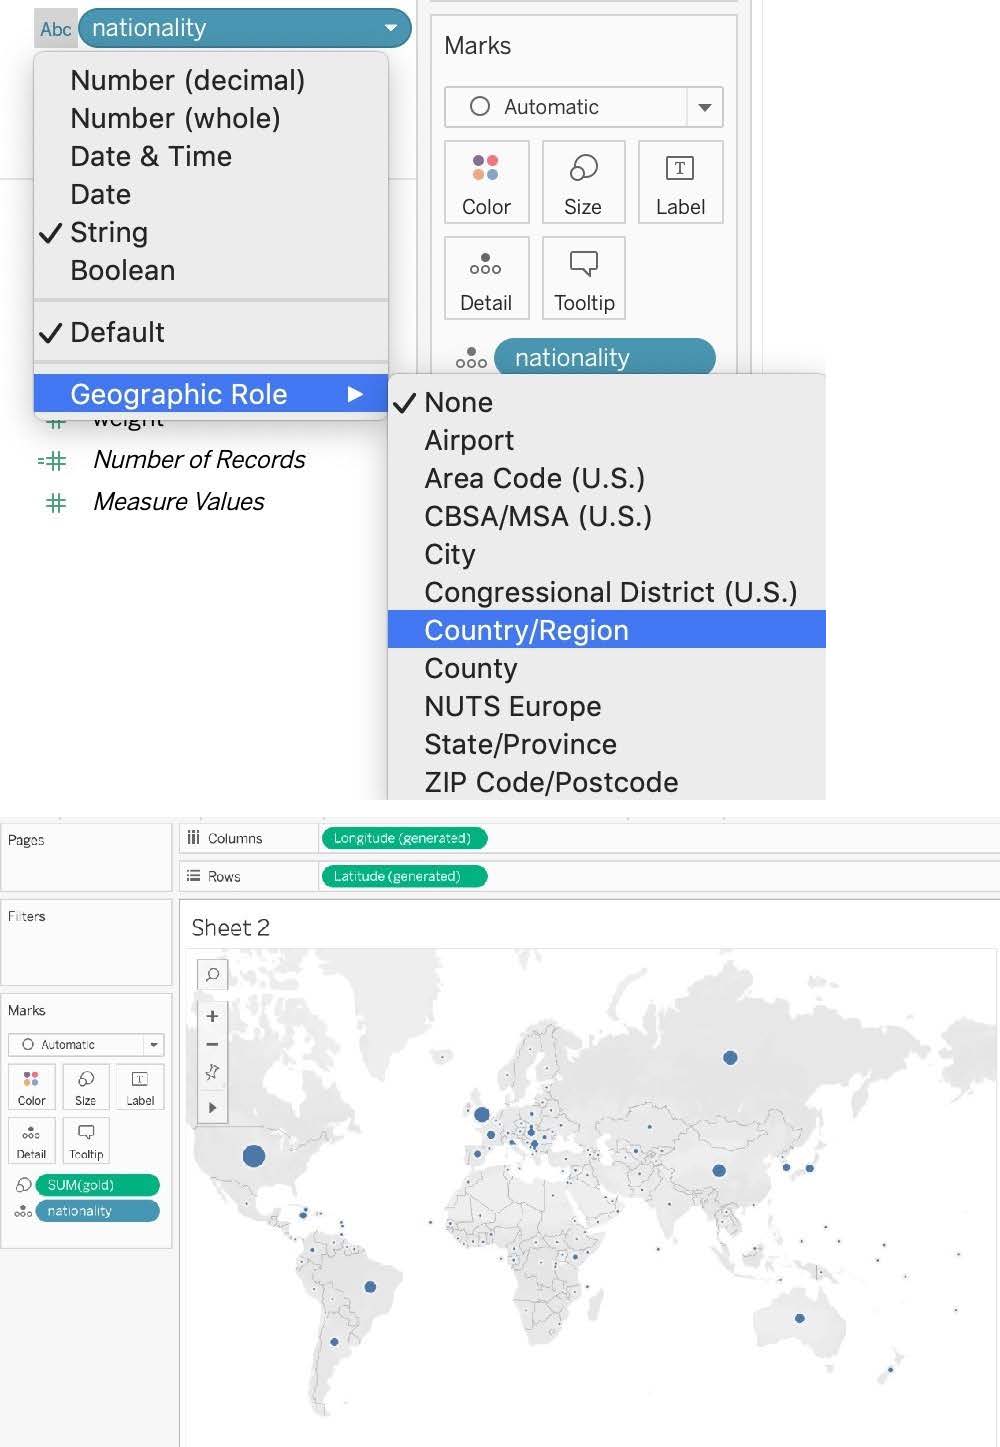
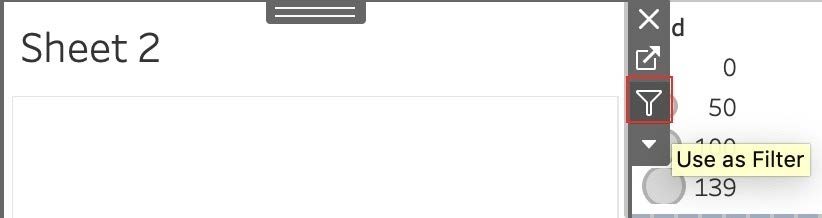
ii) Create a sheet with a Map showing the Total number of gold medals per Country. Use size as a Mark. (Sheet 2)
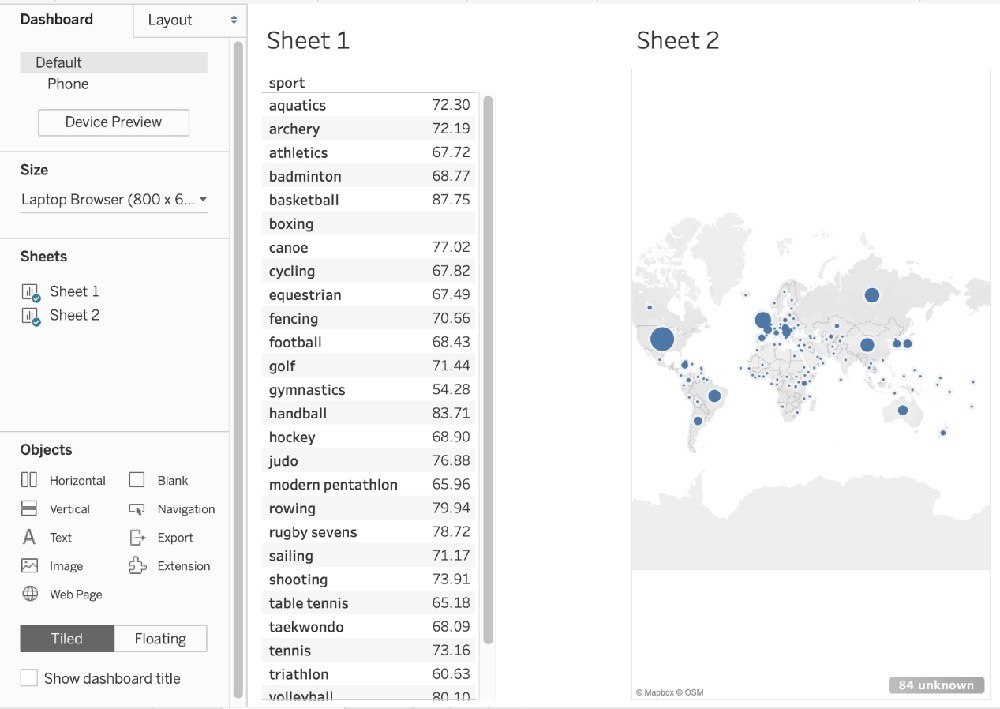
Now, Create a Dashboard containing both these sheets, and Use Sheet 2 as a Filter for Sheet 1. What was the average weight for Badminton in Russia?
(Ignore any nulls / unknowns)
A. 76.25
B. 65.67
C. 68.77
D. 4.87

Tips on How to Prepare for the Exams
Nowadays, the certification exams become more and more important and required by more and more enterprises when applying for a job. But how to prepare for the exam effectively? How to prepare for the exam in a short time with less efforts? How to get a ideal result and how to find the most reliable resources? Here on Vcedump.com, you will find all the answers. Vcedump.com provide not only Tableau exam questions, answers and explanations but also complete assistance on your exam preparation and certification application. If you are confused on your TDS-C01 exam preparations and Tableau certification application, do not hesitate to visit our Vcedump.com to find your solutions here.