Exam Details
Exam Code
:1Z0-117Exam Name
:Oracle Database 11g Release 2: SQL Tuning ExamCertification
:Oracle CertificationsVendor
:OracleTotal Questions
:125 Q&AsLast Updated
:Jul 08, 2025
Oracle Oracle Certifications 1Z0-117 Questions & Answers
-
Question 91:
A database supports three applications: CRM, ERP, and ACC. These applications connect to the database by using three different services: CRM_SRV for the
CRM application, ERP_SRV for the ERP application, and ACC_SRV for the ACC application.
You enable tracing for the ACC_SRV service by issuing the following command:
SQL> EXECUTE DBMS for the ACC_SRV service by issuing the following command:
SQL> EXECUITIVE DBMS_MONITOR. SERV_MOD_ACT_TRACE_ENABLE
(service_name => `ACC_SRV', waits => TRUE, binds = > FALSE, instance_name = > `inst1');
Which statement is true?
A. All trace information for the service connection to inst1 will be stored in a single trace file.
B. A trace file is not created because the module name is not specified.
C. A single trace file is created for each session that uses the ACC_SRV service.
D. Only those SQL statements that are identified with the ACC_SRV service executed on the inst1 instance are recorded in trace files.
E. All trace information for the ACC_SRV service connected to inst1 is stored in multiple trace files, which can be consolidated by using the tkprof utility.
-
Question 92:
Examine the exhibit.
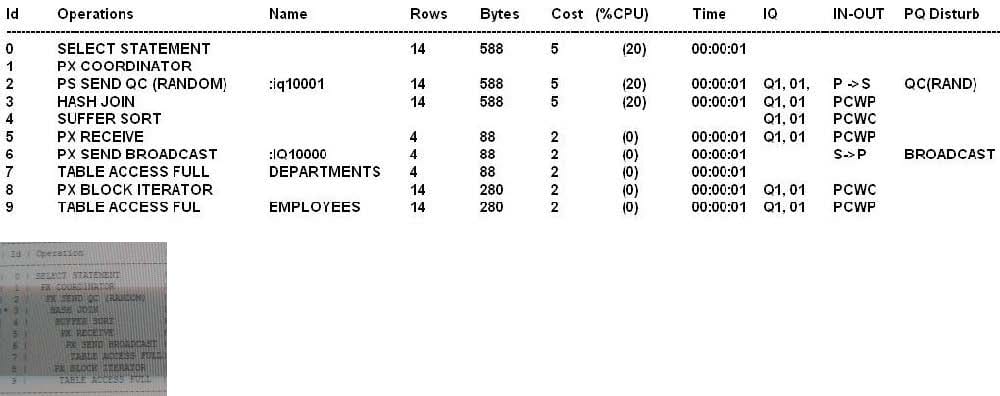
Which is true based on the information obtainable from the execution plan?
A. A full partition-wise join performed between the EMPLOYEES and DEPARTMENTS tables.
B. A full table scan on the DEPARTMENTS table performed serially by the query coordinator.
C. A full table scan on the DEPARTMENTS table is performed serially by a single parallel execution server process.
D. A partial partition-wise join performed between the EMPLOYEES and DEPARTMENTS tables.
E. A full table scan on the EMPLOYEES table is done in parallel.
-
Question 93:
You enable auto degree of parallelism (DOP) for your database instance.
Examine the following query:

Which two are true about the execution of statement?
A. Dictionary DOP for the objects accessed by the query is used to determine the statement DOP.
B. Auto DOP is used to determine the statement DOP only if the estimated serial execution time exceeds PARALLEL_MIN_TIME_THRESHOLD.
C. Dictionary DOP is used to determine the statement DOP only if the estimated serial execution time exceeds PARALLEL_MIN_TIME_THRESHOLD.
D. The statement will be queued if insufficient parallel execution slaves are available to satisfy the statements DOP.
E. The statement will be queued if the number of busy parallel execution servers exceeds PARALLEL_SERVERS_TARGET.
F. The statements may execute serially.
-
Question 94:
You are logged in as the HR user and you execute the following procedure:
SQL > exec DBMS_STATS.SET_TABLE_PREFS (`HR', `EMPLOYEES', `PUBLISH', `FALSE'); SQL> exec DBMS_STATS.GATHER_TABLE_STATS (`HR', `EMPLOYEES');
Which statement is true about the newly gathered statistics?
A. They are temporary and purged when the session exits.
B. They are used by the optimizer for all sessions.
C. They are locked and cannot be overwritten.
D. They are marked as pending and stored in the pending statistics table.
-
Question 95:
You are administering database that supports an OLTP workloads. Most of the queries use an in- dex range scan or index unique scan as access methods.
Which three scenarios can prevent the index access being used by the queries?
A. When highly selective filters is applied on an indexed column of a table with sparsely popu- lated blocks.
B. When the rows are filtered with an IS NULL operator on the column with a unique key de- fined
C. When the histogram statistics are not collected for the columns used in where clause.
D. When a highly selective filter is applied on the indexed column and the index has very low value for clustering factor.
E. When the statistics for the table are not current.
-
Question 96:
Examine the parallelism parameter for your instance:
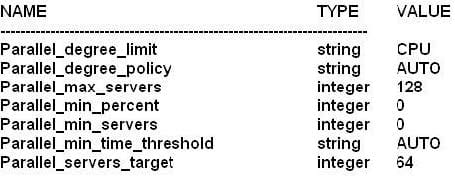
parallel_servers_target
Now examine the resource plan containing parallel statement directives:
Consumer Group resource plan containing parallel statement directives:
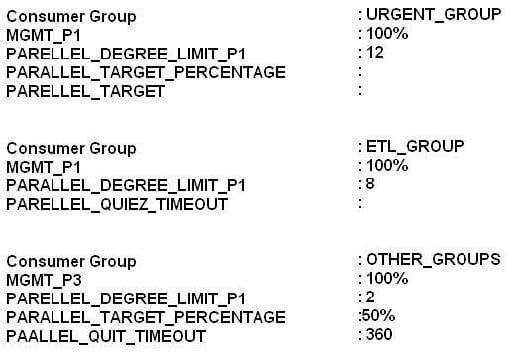
Which two are true about parallel statement queuing when this plan is active?
A. Urgent_group sessions collectively can consume up to 64 parallel execution servers before queuing starts for this consumer group.
B. ETL_GROUP sessions can collectively consume up to 64 parallel execution servers before the queuing starts for this consumer.
C. A single OTHER_GROUPS session will execute serially once it is queued for six minutes.
D. A single ETL_GROUP session can consume up to eight parallel execution servers.
E. A single ETL_GROUP session can consume up to 32 parallel execution servers.
F. A single OTHER_GROUPS session will execute in parallel once it is queued for six minutes.
-
Question 97:
View the Exhibit1 and examine the structure and indexes for the MYSALES table.
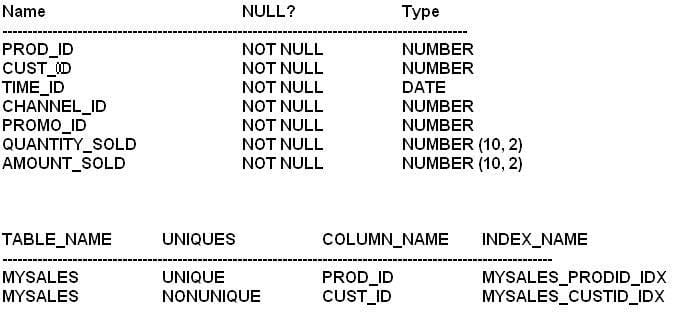
The application uses the MYSALES table to insert sales record. But this table is also extensively used for generating sales reports. The PROD_ID and CUST_ID columns are frequently used in the WHERE clause of the queries. These columns are frequently used in WHERE clause of the queries. These columns have few distinct values relative to the total number of rows in the table.
View exhibit 2 and examine one of the queries and its auto trace output. What should you do to improve the performance of the query?
A. Use the INDEX_COMBINE hint in the query.
B. Create composite index involving the CUST_ID and PROD_ID columns.
C. Gather histograms statistics for the CUST_ID and PROD_ID columns.
D. Gather index statistics for the MYSALES_PRODID_IDX and MYSALES_CUSTID_IDX indexes.
-
Question 98:
You are administering a database that supports an OLTP application. To set statistics preferences, you issued the following command:
SQL > DBMS_STATS.SET_GLOBAL_PREFS (`ESTIMATE_PERCENT', `9');
What will be the effect of executing this procedure?
A. It will influence the gathering of statistics for a table based on the value specified for ESTIMATE_PERCENT provided on table preferences for the same table exist.
B. It will influence dynamic sampling for a query to estimate the statistics based on ESTIMATE_PERCENT.
C. The automatic statistics gathering job running in the maintenance window will use global preferences unless table preferences for the same table exist.
D. New objects created will use global preference even if table preferences are specified.
-
Question 99:
Tracing has been enabled for the HR user. You execute the following command to check the contents of the orcl_25052.trc trace file, which was generated during tracing:

Which two statements are correct about the execution of the command?
A. SCRIPT.SQL stores the statistics for all traced SWL statements.
B. Execution plans for SQL statements are stored in TEMP_PLAN_TABLE and can be queried by the user.
C. SQL statements in the output files are stored in the order of elapsed time.
D. TKPROF use TEMP_PLAN_TABLE in the HR schema as a temporary plan table.
E. Recursive SQL statements are included in the output file.
-
Question 100:
Examine the utilization parameters for an instance:
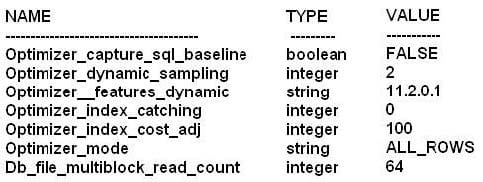
You notice that despite having an index on the column used in the where clause, queries use full table scans with highly selective filters.
What are two possible reasons for the optimizer to use full table scans instead of index unique scans and index range scans?
A. The OPTIMIZER_MODE parameter is set to ALL_ROWS.
B. The clustering factor for the indexes is high.
C. The number of leaf blocks for the indexes is high.
D. The OPTIMIZER_INDEX_COST_ADJ initialization parameter is set to 100.
E. The blocks fetched by the query are greater than the value specified by the DB_FILE_MULTIBLOCK_READ_COUNT parameter.
Related Exams:
1Z0-020
Oracle8i: New Features for Administrators1Z0-023
Architecture and Administration1Z0-024
Performance Tuning1Z0-025
Backup and Recovery1Z0-026
Network Administration1Z0-034
Upgrade Oracle9i/10g OCA to Oracle Database OCP1Z0-036
Managing Oracle9i on Linux1Z0-041
Oracle Database 10g: DBA Assessment1Z0-052
Oracle Database 11g: Administration Workshop I1Z0-053
Oracle Database 11g: Administration II
Tips on How to Prepare for the Exams
Nowadays, the certification exams become more and more important and required by more and more enterprises when applying for a job. But how to prepare for the exam effectively? How to prepare for the exam in a short time with less efforts? How to get a ideal result and how to find the most reliable resources? Here on Vcedump.com, you will find all the answers. Vcedump.com provide not only Oracle exam questions, answers and explanations but also complete assistance on your exam preparation and certification application. If you are confused on your 1Z0-117 exam preparations and Oracle certification application, do not hesitate to visit our Vcedump.com to find your solutions here.
