Exam Details
Exam Code
:1Z0-117Exam Name
:Oracle Database 11g Release 2: SQL Tuning ExamCertification
:Oracle CertificationsVendor
:OracleTotal Questions
:125 Q&AsLast Updated
:Mar 26, 2025
Oracle Oracle Certifications 1Z0-117 Questions & Answers
-
Question 101:
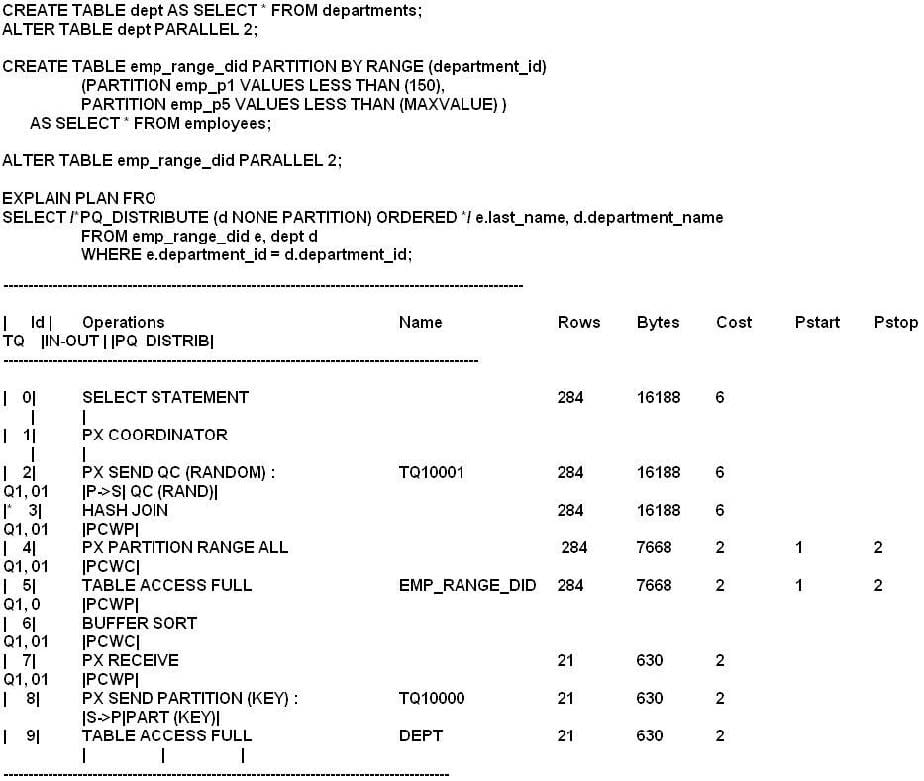
Examine the Exhibit.

Which two options are true about the execution plan and the set of statements?
A. The query uses a partial partition-wise join.
B. The degree of parallelism is limited to the number of partitions in the EMP_RANGE_DID table.
C. The DEPT table id dynamically distributed based on the partition keys of the EMP_RANGE_DID table.
D. The server process serially scans the entire DEPT table for each range partition on the EMP_RANGE_DID table.
E. The query uses a full partition-wise join.
-
Question 102:
What are three common reasons for SQL statements to perform poorly?
A. Full table scans for queries with highly selective filters
B. Stale or missing optimizer statistics
C. Histograms not existing on columns with evenly distributed data
D. High index clustering factor
E. OPTIMIZER_MODE parameter set to ALL_ROWS for DSS workload
-
Question 103:
One of your databases supports a mixed workload.
When monitoring SQL performance, you detect many direct paths reads full table scans.
What are the two possible causes?
A. Histograms statistics not available
B. Highly selective filter on indexed columns
C. Too many sort operations performed by queries
D. Indexes not built on filter columns
E. Too many similar type of queries getting executed with cursor sharing disabled
-
Question 104:
A new application module is deployed on middle tier and is connecting to your database. You want to monitor the performance of the SQL statements generated from the application.
To accomplish this, identify the required steps in the correct order from the steps given below:
1.
Use DBNMS_APPLICATION_INFO to set the name of the module
2.
Use DBMS_MONITOR.SERV_MOD_ACT_STAT_ENABLE to enable statistics gathering for the module.
3.
Use DBMS_MONITOR.SERV_MOD_ACT_TRACE_ENABLE to enable tracing for the service
4.
Use the trcsess utility to consolidate the trace files generated.
5.
Use the tkprof utility to convert the trace files into formatted output.
A. 1, 2, 3, 4, 5
B. 2, 3, 1, 4, 5
C. 3, 1, 2, 4, 5
D. 1, 2, 4, 5
E. 1, 3, 4, 5
F. 2, 1, 4, 5
-
Question 105:
You are administering a database supporting an OLTP workload. A new module was added to one of the applications recently in which you notice that the SQL statements are highly resource intensive in terms of CPU, I/O and temporary space. You created a SQL Tuning Set (STS) containing all resource-intensive SQL statements. You want to analyze the entire workload captured in the STS. You plan to run the STS through the SQL Advisor.
Which two recommendations can you get?
A. Combing similar indexes into a single index
B. Implementing SQL profiles for the statements
C. Syntactic and semantic restructuring of SQL statements
D. Dropping unused or invalid index.
E. Creating invisible indexes for the workload
F. Creating composite indexes for the workload
-
Question 106:
Which two types of SQL statements will benefit from dynamic sampling?
A. SQL statements that are executed parallel
B. SQL statement that use a complex predicate expression when extended statistics are not available.
C. SQL statements that are resource-intensive and have the current statistics
D. SQL statements with highly selective filters on column that has missing index statistics
E. Short-running SQL statements
-
Question 107:
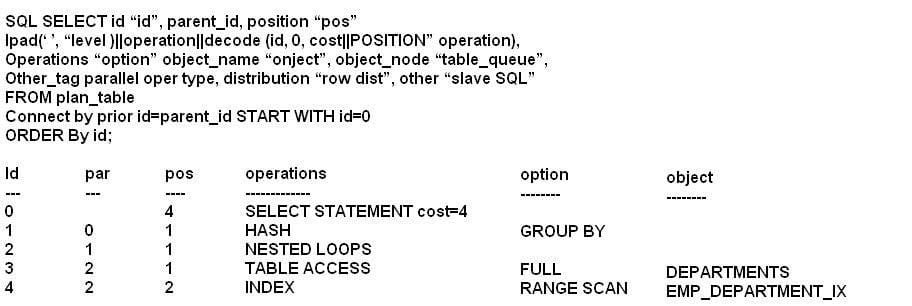
Exhibit

Examine the following SQL statement:

Examine the exhibit to view the execution plan. Which statement is true about the execution plan?
A. The EXPLAIN PLAN generates the execution plan and stores it in c$SQL_PLAN after executing the query. Subsequent executions will use the same plan.
B. The EXPLAIN PLAN generates the execution plan and stores it in PLAN_TABLE without executing the query. Subsequent executions will always use the same plan.
C. The row with the ID 3 is the first step executed in the execution plan.
D. The row with the ID 0 is the first step executed in the execution plan.
E. The rows with the ID 3 and 4 are executed simultaneously.
-
Question 108:
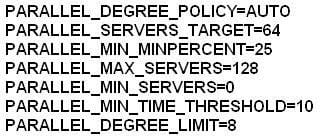
You instance has these parameter settings:

Which three statements are true about these settings if no hints are used in a SQL statement?
A. A statement estimated for more than 10 seconds always has its degree of parallelism computed automatically.
B. A statement with a computed degree of parallelism greater than 8 will be queued for a maximum of 10 seconds.
C. A statement that executes for more than 10 seconds always has its degree of parallelism computed automatically.
D. A statement with a computed degree of parallelism greater than 8 will raise an error.
E. A statement with any computed degree of parallelism will be queued if the number of busy parallel execution processes exceeds 64.
F. A statement with a computed degree of parallelism of 20 will be queued if the number of available parallel execution processes is less 5.
-
Question 109:
When would bind peeking be done for queries that vary only in values used in the WHERE clause?
A. When the column used in the WHERE clause has evenly distributed data and histogram exists on that column.
B. When the column used in the WHERE clause has evenly distributed data and index exists on that column.
C. When the column used in the WHERE clause has non uniform distribution of data, uses a bind variable, and no histogram exists for the column.
D. When the column used in the WHERE clause has non uniform distribution of data and histogram exists for the column.
-
Question 110:
Which type of SQL statement would be selected for tuning by the automatic SQL framework?
A. Serial queries that are among the costliest in any or all of the four categories: the past week, any day in the past week, any hour in the past week, or single response, and have the potential for improvement
B. Serial queries that have been tuned within the last 30days and have been SQL profiled by the SQL tuning Advisor.
C. Serial and parallel queries that top the AWR Top SQL in the past week only and have been SQL profiled by the SQL Tuning Advisor.
D. Serial queries that top the AWR Top SQL in the past week only and whose poor performance can be traced to concurrency issues.
E. Serial and parallel queries that are among the costliest in any or all of the four categories: the past week, and day in the past week, any hour in the past week, or a single response, and that can benefit from access method changes.
Related Exams:
1Z0-020
Oracle8i: New Features for Administrators1Z0-023
Architecture and Administration1Z0-024
Performance Tuning1Z0-025
Backup and Recovery1Z0-026
Network Administration1Z0-034
Upgrade Oracle9i/10g OCA to Oracle Database OCP1Z0-036
Managing Oracle9i on Linux1Z0-041
Oracle Database 10g: DBA Assessment1Z0-052
Oracle Database 11g: Administration Workshop I1Z0-053
Oracle Database 11g: Administration II
Tips on How to Prepare for the Exams
Nowadays, the certification exams become more and more important and required by more and more enterprises when applying for a job. But how to prepare for the exam effectively? How to prepare for the exam in a short time with less efforts? How to get a ideal result and how to find the most reliable resources? Here on Vcedump.com, you will find all the answers. Vcedump.com provide not only Oracle exam questions, answers and explanations but also complete assistance on your exam preparation and certification application. If you are confused on your 1Z0-117 exam preparations and Oracle certification application, do not hesitate to visit our Vcedump.com to find your solutions here.