Exam Details
Exam Code
:CLSSBBExam Name
:Certified Lean Six Sigma Black Belt (LSSBB)Certification
:Six Sigma CertificationsVendor
:Six SigmaTotal Questions
:639 Q&AsLast Updated
:Apr 10, 2025
Six Sigma Six Sigma Certifications CLSSBB Questions & Answers
-
Question 421:
The following is a set of individual measurements:
3 5 4 5 6 3 4 3 2 4 5 6 5 7 6 4 5 5 8 7 6 6 7 7 4
Find the control limits for the individuals chart.
A. .7 and 11.2
B. 1.6 and 8.6
C. 2.7 and 7.5
D. none of the above
-
Question 422:
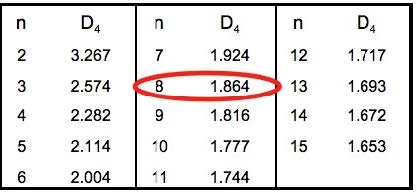
A set of data from a process has 8 readings per sample and 50 samples. The mean of the 50 sample means is 12.62. The mean of the 50 ranges is 0.18.A customer requires that SPC charts be done on their forms which have spaces for only 5 readings per sample. In preparation for calculating the new control limits the following question is asked, "Will the new average range be larger or smaller than the current average range?". The answer is:
A. yes
B. no
C. maybe
D. smaller
E. larger
F. same size
G. none of the above
-
Question 423:
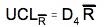
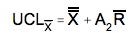
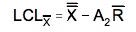
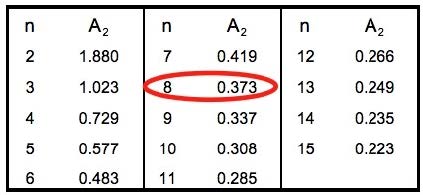
A set of data from a process has 8 readings per sample and 50 samples. The mean of the 50 sample means is 12.62. The mean of the 50 ranges is 0.18.A customer requires that SPC charts be done on their forms which have spaces for only 5 readings per sample. What should be the UCL and LCL for tbe new averages chart?
A. 12.53 and 12.71
B. 12.58 and 12.66
C. 11.61 and 13.63
D. none of the above
-
Question 424:
A set of data from a process has 8 readings per sample and 50 samples. The mean of the 50 sample means is 12.62. The mean of the 50 ranges is 0.18.Find the control limits for a median chart.
A. 12.52 and 12.72
B. 12.54 and 12.70
C. 0.02 and 0.33
D. none of the above
-
Question 425:
A set of data from a process has 8 readings per sample and 50 samples. The mean of the 50 sample means is 12.62. The mean of the 50 ranges is 0.18.Find control limits for the R chart.
A. 0.10 and 0.25
B. none and 0.33
C. 0.02 and 0.33
D. none of the above
-
Question 426:
A set of data from a process has 8 readings per sample and 50 samples. The mean of the 50 sample means is 12.62. The mean of the 50 ranges is 0.18. Find the control limits for the xbar chart.
A. 12.55 and 12.69
B. 12.11 and 13.13
C. 12.54 and 12.70
D. none of the above
-
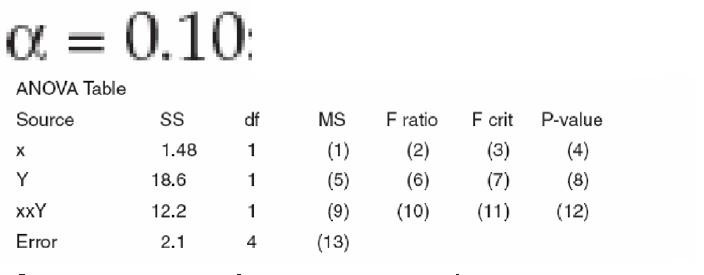
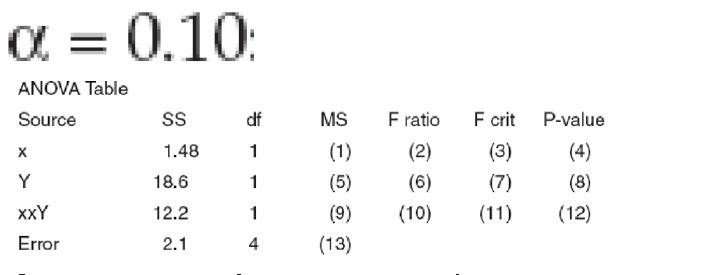
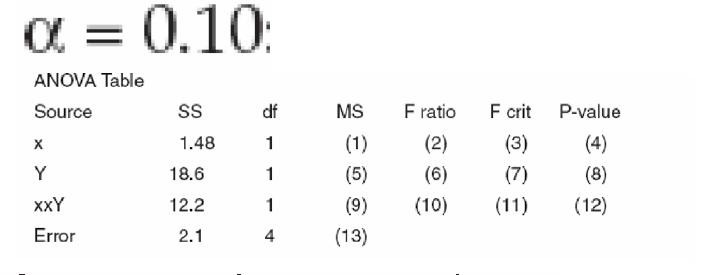
Question 427:
Find the value of (13) in the ANOVA table. Assume:

A. 16.4
B. 3.2
C. 18.6
D. 23.2
E. 4.54
F. 12.2
G. 0.525
H. 2.82
I. 1.48
J. 35.4
K. 0.10
L. 0.05
M. 0.01
N. 0.005
O. 0
-
Question 428:
Find the value of (12) in the ANOVA table. Assume:
A. 16.4
B. 3.2
C. 18.6
D. 23.2
E. 4.54
F. 12.2
G. 0.525
H. 2.82
I. 1.48
J. 35.4
K. 0.10
L. 0.05
M. 0.01
N. 0.005
O. 0
-
Question 429:
Find the value of (10) in the ANOVA table. Assume:
A. 16.4
B. 3.2
C. 18.6
D. 23.2
E. 4.54
F. 12.2
G. 0.525
H. 2.82
I. 1.48
J. 35.4
K. 0.10
L. 0.05
M. 0.01
N. 0.005
O. 0
-
Question 430:
Find the value of (9) in the ANOVA table. Assume:
A. 16.4
B. 3.2
C. 18.6
D. 23.2
E. 4.54
F. 12.2
G. 0.525
H. 2.82
I. 1.48
J. 35.4
K. 0.10
L. 0.05
M. 0.01
N. 0.005
O. 0

Related Exams:
Tips on How to Prepare for the Exams
Nowadays, the certification exams become more and more important and required by more and more enterprises when applying for a job. But how to prepare for the exam effectively? How to prepare for the exam in a short time with less efforts? How to get a ideal result and how to find the most reliable resources? Here on Vcedump.com, you will find all the answers. Vcedump.com provide not only Six Sigma exam questions, answers and explanations but also complete assistance on your exam preparation and certification application. If you are confused on your CLSSBB exam preparations and Six Sigma certification application, do not hesitate to visit our Vcedump.com to find your solutions here.