Microsoft Microsoft Certifications 77-427 Questions & Answers
Question 21:
You work as an Office Assistant for Blue Well Inc. The company has a Windows-based network. You want to get the trend of the Business data range. For this purpose, you want to use trendlines in the chart. Which of the following steps will you take to apply the trendlines in the chart?
Each correct answer represents a part of the solution. Choose all that apply.
A. Clear the check box of any Trendline fields to disconnect a slicer.
B. Select the type that you want from Trendline options.
C. Click the Insert Trendline arrow, and then click Trendline Connections on the Options tab in the Sort and Filter group.
D. Select a chart and then navigate to the Chart Tools Layout tab.
Correct Answer: BD
Question 22:
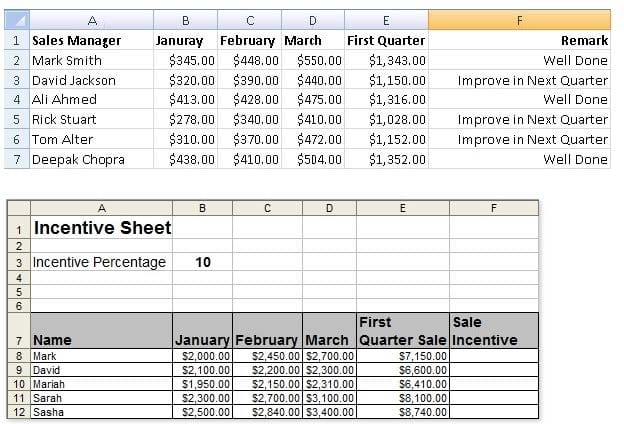
You work as a Sales Manager for Tech Perfect Inc. You are creating a report for your sales team
Using Microsoft Excel. You want the report to appear in the following format:
You want the Remark column to be filled through a conditional formula. The criteria to give the remark is as follows:
If the sales of the First Quarter are greater than or equal to 1200, display "Well Done" If the sales of the First Quarter is less than 1200, display "Improve in Next Quarter"
You have done most of the entries in a workbook. You select the F2 cell as shown in the image given below:
Which of the following conditional formulas will you insert to accomplish the task?
A. =IF(E2>=1200,"Improve in Next Quarter","Well Done")
B. =IF(E2<=1200,"Well Done","Improve in Next Quarter")
C. =IF(E2>=1200,"Well Done","Improve in Next Quarter")
D. =IF(E2>1200,"Improve in Next Quarter","Well Done")
Correct Answer: C
In order to accomplish the task, you will have to insert the following formula in the F2 cell:
=IF(E2>=1200,"Well Done","Improve in Next Quarter") Answer option A is incorrect. This will display the wrong messages for the given conditions.
The first expression after the logical condition is returned by the IF function when the condition is TRUE.
Answer option B is incorrect. This formula will not accomplish the task as the logical condition is not correct. The specified condition in this formula is testing for values less than or equal to 1200. Whereas, the question's requirement is to
evaluate values greater than or equal to 1200.
Answer option D is incorrect. This formula will not accomplish the task because of the two reasons.
First, the equal sign is missing in the condition. Second, the expressions are not in the correct order.
Question 23:
You work as an Office Assistant for Media Perfect Inc. You have created a report in Excel. You have inserted the following formula in a cell:
VLOOKUP(12, A2:C10, 3, FALSE )
Which of the following actions will be performed by the formula?
A. Search for the value 12 in the first column of the range, and then returns the value that is contained in the third column of the range and on the same row as the lookup value.
B. Wrong syntax used.
C. Search the value 3 in the last column of the range, and then returns the value that is in the column of the range and on the same row as the lookup value.
D. Search the value 12 in the third column of the range and then returns the value that is contained in the 12th column of the range and on the same column as the lookup value.
Correct Answer: A
The formula will search for the value 12 in the first column of the range, and then returns the value that is contained in the third column of the range and on the same row as the lookup value.
Question 24:
Which of the following can be defined as easy-to-use filtering components containing a set of buttons that enable users to quickly filter data in a PivotTable report, without opening drop-down lists to find the items to filter?
A. Accounting templates
B. ActiveX controls
C. Form controls
D. Slicers
Correct Answer: D
Slicers are defined as easy-to-use filtering components containing a set of buttons that enable users to quickly filter data in a PivotTable report, without opening drop-down lists to find the items to filter.
When a user uses a regular PivotTable report filter to filter on multiple items, the filter indicates only that multiple items are filtered and the user has to open a drop-down list to find the filtering details. However, a slicer clearly labels the filter
that is applied and provides details so that the data displayed in the filtered PivotTable report can be easily understood.
Answer option B is incorrect. ActiveX controls are used on worksheet forms, with or without the use of VBA code, and on VBA UserForms.
They are used when a user needs more flexible design requirements than those provided by Form controls. They have extensive properties that can be used to customize their appearance, behavior, fonts, and other characteristics. The user
can control different events that occur when an ActiveX control is interacted with. He can also write macros that respond to events associated with the ActiveX controls. When a user interacts with the control, the VBA code runs to process any
events that occur for that control. The ActiveX controls cannot be added to chart sheets from the user interface or to XLM macro sheets. It is not possible to assign a macro to run directly from the ActiveX control. Answer option C is incorrect.
A form control is an original control that is compatible with old versions of Excel, beginning with Excel version 5. 0. It is designed for use on XLM macro sheets. It can be used when a user wants to simply interact with cell data without using
VBA code and when he wants to add controls to chart sheets. By using form controls, the user can run macros. He can attach an existing macro to a control, or write or record a new macro. These controls cannot be added to UserForms,
used to control events, or modified to run Web scripts on Web pages.
Answer option A is incorrect. The accounting template is used for numbering months of a financial year to period numbering. It is used to compare month to month, actual v budget, quarter to quarter, year to year variances. It is the initial point
for other reports that need the use of months.
Question 25:
Rick works as an Office Assistant for Tech Perfect Inc. He is creating a user form through
Microsoft Excel 2013. While creating forms for a number of users, he is required to repeat some of the actions multiple times. It is a very time consuming process. To resolve this issue, he wants to record the sequence of actions to perform a certain task and to play them back in the same order.
Which of the following actions will Rick take to accomplish the task?
A. He will use the Trust Center bar.
B. He will use the Evaluate Formula tool.
C. He will put the workbook in a trusted location.
D. He will create and run a macro.
Correct Answer: D
A macro is defined as a tool that permits a user to automate tasks and add several functionalities to forms, reports, and controls. For example, if a user adds a command button to a form, he associates the button's OnClick event to a macro,
and the macro consists of the commands that are to be performed by the button each time it is clicked. The macro records the user's mouse clicks and keystrokes while he works and lets him play them back later. The macro can be used to
record the sequence of commands that the user uses to perform a certain task. When the user runs the macro, it plays those exact commands back in the same order.
Answer option B is incorrect. Evaluate Formula is a formula examination tool provided by Microsoft Excel. This tool is useful for examining formulas that do not produce any error but are not generating the expected result.
Answer options A and C are incorrect. The benefit of connecting to external data from Microsoft Excel is that a user can automatically update Excel workbooks from the real data source wheneverthe data source is updated with new
information. It is possible that the external data connection might be disabled on the computer. For connecting to the data source whenever a workbook is opened, it is required to enable data connections by using the Trust Center bar or by
putting the workbook in a trusted location.
Question 26:
You work as an Office Manager for Blue Well Inc. The company has a Windows-based network. You have two budget situations in which one is the worst case and the other is the best case. You want to create both situations on the same worksheet and then switch between them with the change in requirements. Which of the following will you use to accomplish the task?
A. Goal Seek
B. Data table
C. Scenario
D. Solver add-in
Correct Answer: C
A scenario is defined as a type of what-if analysis tools. It is a set of values saved by Excel and can be substituted automatically in cells on a worksheet. A user can create and save different groups of values on a worksheet and then switch to any of these new scenarios to view different results. Scenario reports are not automatically recalculated. If the user changes the values of a scenario, those changes will not be displayed in an existing summary report and he must create a new summary report to show the reflection of the changed report. Answer option A is incorrect. Goal Seek is defined as a type of what-if analysis tools. It is used if a user knows the result that he wants from a formula, but he is not sure what input value the formula needs to get that result. It works with only one variable input value. Answer option D is incorrect. The Solver add-in is used if a user knows the result that he wants from a formula, but he is not sure what input value the formula needs to get that result. It is used for more than one input value. It works with a group of cells related to the formula in the objective cell. Answer option B is incorrect. A data table is used to see all the outcomes in one place. It is defined as a type of what-if analysis tools. It is used if a user has a formula that uses one or two variables or multiple formulas that all use one common variable. It is used to examine a range of possibilities at a glance and since the user focuses on only one or two variables, results are easy to read and share in tabular form. If automatic recalculation is enabled, it is possible to recalculate the data in data tables immediately and as a result, the user always gets fresh data.
Question 27:
You work as an Office Assistant for Tech Perfect Inc. You are working in a spreadsheet. You observe that while trying to look up or match a lookup_value within an array, Excel is not able to recognize the matching value. Which of the following are the reasons that are causing the above problem?
Each correct answer represents a complete solution. Choose all that apply.
A. The lookup_value or the array you are searching resides in a cell containing unseen spaces at the start or end of that cell.
B. The contents of the cells that are being compared may have different data types.
C. Excel is trying to reference an invalid cell.
D. You are inserting a new column, next to a column that is already formatted as text.
Correct Answer: AB
The Failure to Look Up Values in Excel error occurs when a user gets an unexpected error while trying to look up or match a lookup_value within an array and Excel is not able to recognize the matching value. If the lookup_value or the array the user is searching resides in a cell, the user can have unseen spaces at the start or end of that cell. This will create the situation where the contents of the two cells that the user is comparing look the same but extra spaces in one of the cells cause the cells to have slightly different content. The other reason is that the contents of the cells that are being compared may have different data types. Answer option C is incorrect. The Lookup Function Won't Copy Down to Other Rows error occurs when a user uses a function in one cell and it works perfectly but when he attempts to copy the function down to other rows, he gets the #REF error. The #REF! error arises when Excel tries to reference an invalid cell. This error occurs if the user has referenced an entire worksheet by clicking on the grey square at the top left of the worksheet. For Excel, this reference range is 1 to 1048576. Since the references are Relative References, Excel automatically increases the row references when this cell is copied down to other rows in the spreadsheet. Answer option D is incorrect. The Excel Won't Calculate My Function error occurs when a user types in a function and presses Enter, the cell shows the function as the user typed it, instead of returning the function's value. The reason that causes this problem is that the cells containing the formula are formatted as 'text' instead of the 'General' type. This happens when the user inserts a new column, next to a column that is already formatted as text due to which the new column inherits the formatting of the adjacent column.
Question 28:
Rick works as an Office Assistant for Tech Perfect Inc. The company has a Windows- based network.
Rick has to perform the following tasks:
Summarize large amounts of data. Analyze numeric data.
Answer unexpected questions about data.
Which of the following actions will Rick take to accomplish the task?
A. He will create the accounting template.
B. He will use stand-alone slicers.
C. He will create a PivotTable report.
D. He will configure form controls.
Correct Answer: C
A PivotTable report is used to summarize large amounts of data, to analyze numerical data, and to answer unexpected questions about data. Answer option B is incorrect. Stand-alone slicers are referenced from Online Analytical Processing
(OLAP) Cube functions. These stand-alone slicers can be connected with any PivotTable in future.
They can be added by using the slicer button on the Ribbon. They need to be manually linked into grids as required.
Answer option D is incorrect. A form control is an original control that is compatible with old versions of Excel, beginning with Excel version 5. 0. It is designed for use on XLM macro sheets. It can be used when a user wants to simply interact
with cell data without using VBA code and when he wants to add controls to chart sheets. By using form controls, the user can run macros. He can attach an existing macro to a control, or write or record a new macro. These controls cannot
be added to UserForms, used to control events, or modified to run Web scripts on Web pages.
Answer option A is incorrect. The accounting template is used for numbering months of a financial year to period numbering. It is used to compare month to month, actual v budget, quarter to quarter, year to year variances. It is the initial point
for other reports that need the use of months.
Question 29:
Which of the following is used to display a trend based on adjacent data in a clear and compact
graphical representation by taking up a small amount of space?
A. Trendline
B. Line chart
C. Sparkline
D. Backstage view
Correct Answer: C
A sparkline is defined as a tiny chart in the background of a cell. Unlike charts on an Excel Worksheet, sparklines are not objects. It is used because data presented in a row or column is useful, but patterns can be hard to spot at a glance. It is used to display a trend based on adjacent data in a clear and compact graphical representation by taking up a small amount of space. The benefit of using the sparklines is that these can be printed when a user prints a worksheet that contains them. This feature is not available in charts. Answer option D is incorrect. The Microsoft Office Backstage view is used to replace the traditional file menu with a new approach that uses In and Out features for efficiency. The improved Ribbon enables users to access their preferred commands rapidly and create custom tabs to personalize the way they work. Answer option A is incorrect. A trendline is defined in Excel 2013. It is a data visualization tool to display the trend of a particular data range. It is used to show the slope of data points in a chart. There are various types of trendlines, such as linear trendlines, exponential trendlines, and linear forecast trendlines. Answer option B is incorrect. Excel provides a column chart facility to display data that is arranged in columns or rows on a worksheet. Line charts are used to display continuous data over time, set against a common scale. In a line chart, category data is distributed along the horizontal axis, and all value data is distributed along the vertical axis. Line charts are ideal for showing trends in data at equal intervals.
A line chart should be used where category labels are text, and are representing evenly spaced Values such as months, quarters, or years.
Question 30:
Rick works as an Office Assistant for Tech Perfect Inc. The company has a Windows- based network.
Rick wants to display data series, categories, data markers, and axes in the report. Which of the
following actions will Rick take to accomplish the task?
A. He will use stand-alone slicers.
B. He will create a PivotTable report.
C. He will configure form controls.
D. He will create a PivotChart report.
Correct Answer: D
The PivotChart report is used to provide a graphical representation of data in a PivotTable report in an interactive way. Whenever a user creates the PivotChart report, PivotChart report filters are displayed in the chart area. These are used for sorting and filtering the underlying data of the PivotChart report. Changes made to the layout and data in the associated PivotTable report are immediately reflected in the layout and data in the PivotChart report. The PivotChart report shows data series, categories, data markers, and axes in the same way as the standard charts do. It is possible to change the chart type and other options such as titles, legend placement, data labels, and chart location. Answer option A is incorrect. Stand-alone slicers are referenced from Online Analytical Processing (OLAP) Cube functions. These stand-alone slicers can be connected with any PivotTable in future. They can be added by using the slicer button on the Ribbon. They need to be manually linked into grids as required.
Answer option C is incorrect. A form control is an original control that is compatible with old versions of Excel, beginning with Excel version 5. 0. It is designed for use on XLM macro sheets. It can be used when a user wants to simply interact
with cell data without using VBA code and when he wants to add controls to chart sheets. By using form controls, the user can run macros. He can attach an existing macro to a control, or write or record a new macro. These controls cannot
be added to UserForms, used to control events, or modified to run Web scripts on Web pages.
Answer option B is incorrect. A PivotTable report is used to summarize large amounts of data, to analyze numerical data, and to answer unexpected questions about data.
Nowadays, the certification exams become more and more important and required by more and more enterprises when applying for a job. But how to prepare for the exam effectively? How to prepare for the exam in a short time with less efforts? How to get a ideal result and how to find the most reliable resources? Here on Vcedump.com, you will find all the answers. Vcedump.com provide not only Microsoft exam questions, answers and explanations but also complete assistance on your exam preparation and certification application. If you are confused on your 77-427 exam preparations and Microsoft certification application, do not hesitate to visit our Vcedump.com to find your solutions here.